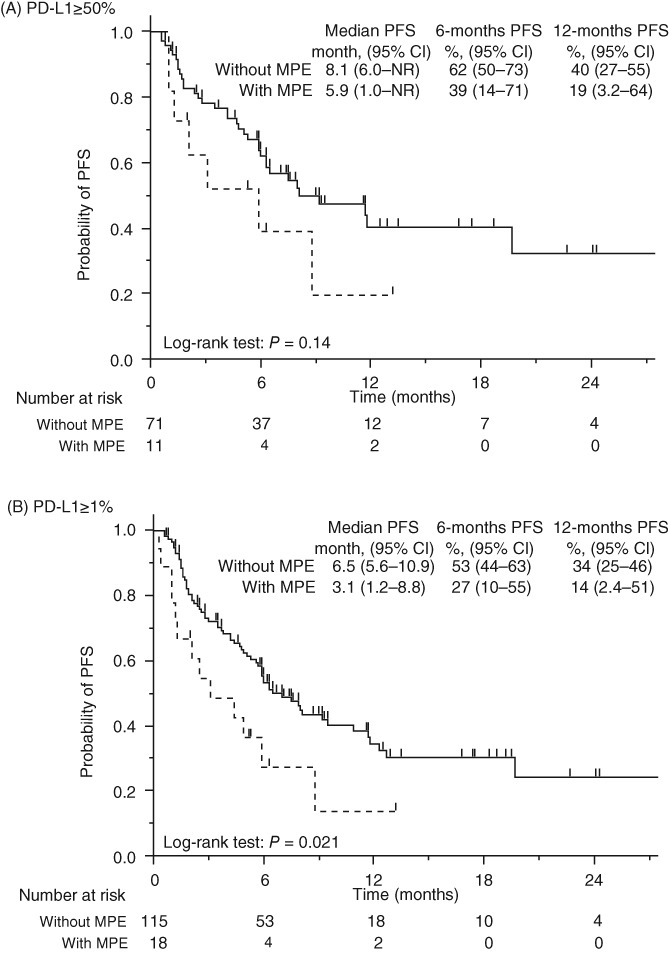
Figure 3.

Kaplan–Meier curves of progression‐free survival (PFS) in patients with PD‐L1 expression in (a) ≥ 50% of tumor cells and (b) ≥ 1% of tumor cells. MPE, malignant pleural effusion; NR, not reached. ( ) Without MPE, and (
 ) With MPE.

Kaplan–Meier curves of progression‐free survival (PFS) in patients with PD‐L1 expression in (a) ≥ 50% of tumor cells and (b) ≥ 1% of tumor cells. MPE, malignant pleural effusion; NR, not reached. ( ) Without MPE, and (
 ) With MPE.