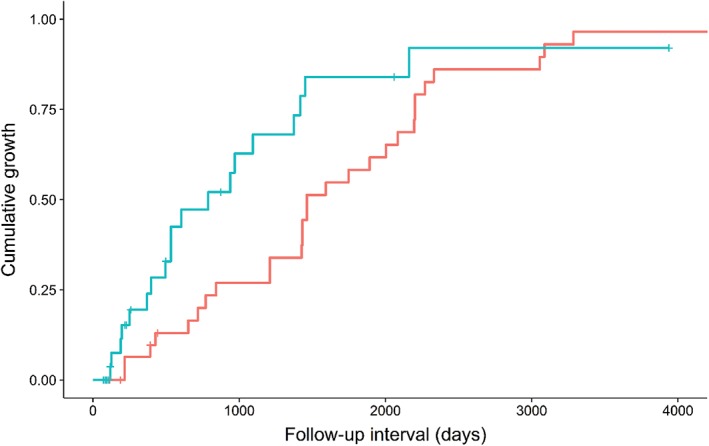
Figure 5.

Kaplan–Meier plot of the cumulative growth of thymic epithelial tumors (TETs) according to size (average diameter). TETs > 17.2 mm showed a higher growth rate at given follow‐up intervals. ( ) Size ≤ 17.2 mm and (
 ) size > 17.2 mm.

Kaplan–Meier plot of the cumulative growth of thymic epithelial tumors (TETs) according to size (average diameter). TETs > 17.2 mm showed a higher growth rate at given follow‐up intervals. ( ) Size ≤ 17.2 mm and (
 ) size > 17.2 mm.