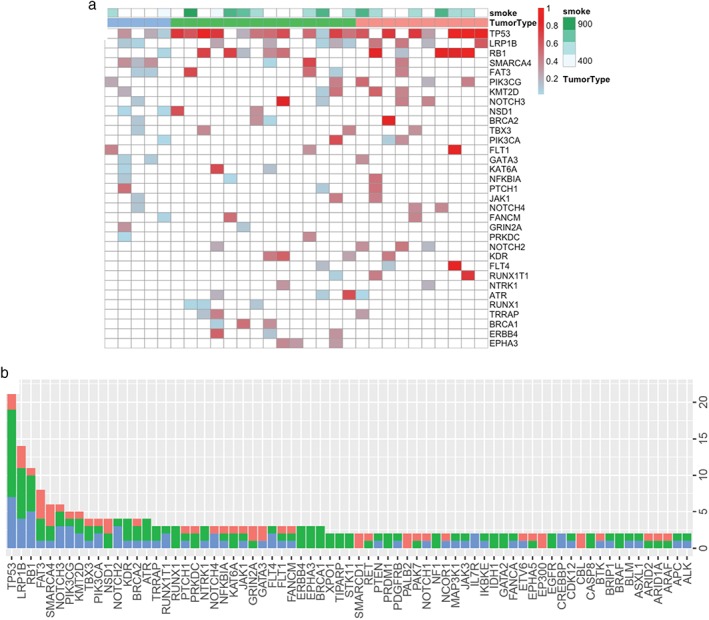
Figure 2.

Mutation spectrum of large cell carcinoma (LCC), large cell neuroendocrine carcinoma (LCNEC), and small cell lung cancer (SCLC). (a) Mutation profiles of each subtype. Smoking history and pathological subtype are denoted on top of the oncoprint. Each column represents a patient and each row represents a gene. The color gradient represents allelic fraction. (b) Bar graph summarizes the mutation frequency of the most frequently mutated genes in this cohort. 
 , LCC;
 , LCNEC;
 , SCLC.
