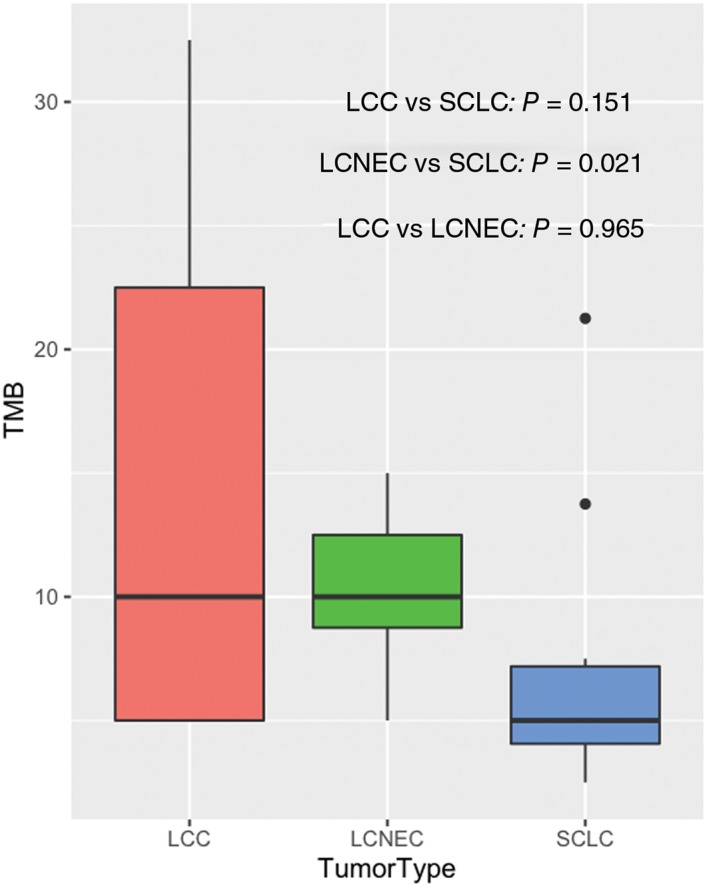
Figure 4.

Tumor mutational burden (TMB) analysis. The black lines in each box denote the median. The bottom and top of each box denote the first and third quartile, respectively. Different colors represent different pathological subtypes. P values were calculated using Wilcoxon rank sum test.  , large cell carcinoma (LCC);
  , large cell neuroendocrine carcinoma (LCNEC);
  , small cell lung cancer (SCLC).
