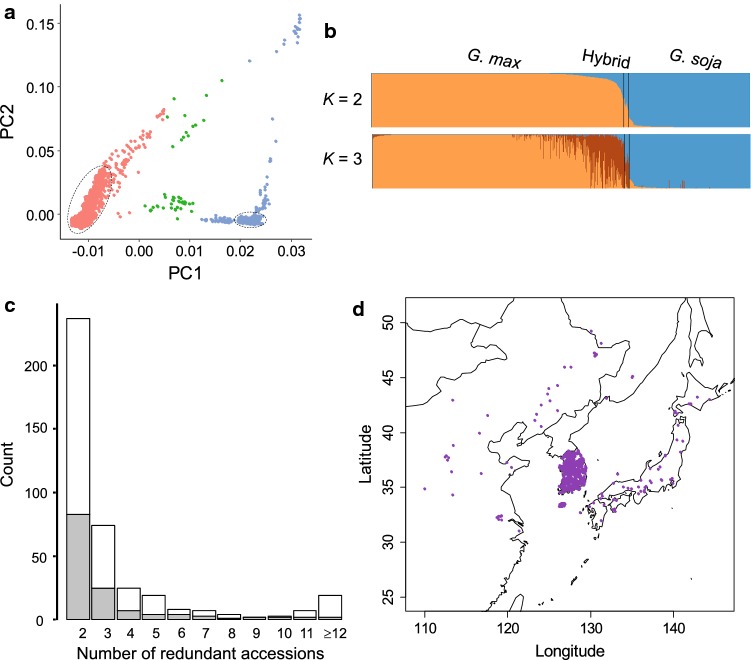
Fig. 1.
Population structure of the genotyped 4234 soybean accessions. a Principal components of SNP variation. PC1 and PC2 indicate score of principal components 1 and 2, respectively. Each of PC1 and PC2 explained 15.6% and 2.7% of variance in the data. Glycine max, G. soja, and hybrids are shown by red, blue, and green dots, respectively. The majority of Korean accessions cluster together within dashed eclipses. b ADMIXTURE plots. The accessions were divided into three groups: G. max, G. soja, and their hybrids. c Distribution of number of redundant accession groups that showed < 1.25% inconsistencies between the SNP calls. G. max and G. soja are shown by white and gray boxes. d Geographic distribution of the collection sites for G. soja accessions

