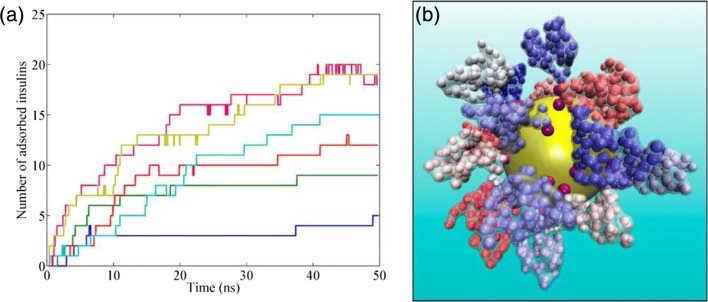
Fig. 4.
Biomolecular corona formation studied with CG modeling. a Moving average (25 time steps; each time step represents 1 fs in real time) of number of insulin proteins adsorbed on citrate-coated gold NP over time. Colors represent different number of insulin molecules in the solution: blue, 10; green, 20; red, 34; cyan, 50; purple, 70; and brown, 100. b Snapshot, from a model simulation of a NP with 70 insulin molecules in solution taken at 45 ns shows the surrounding corona formation. Reproduced with permission from (Tavanti et al. 2015b)

