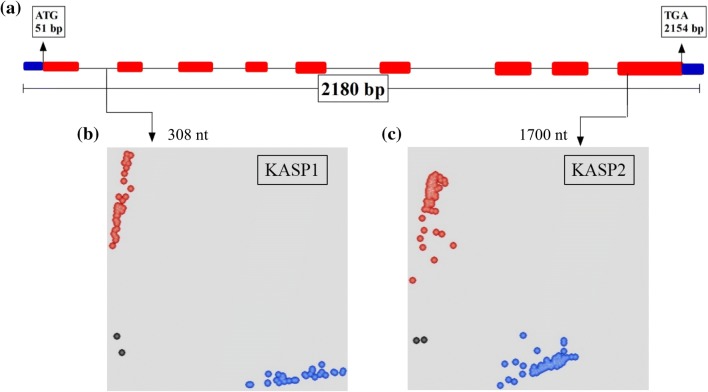
Fig. 2.
Gene structure and functional marker development for TaSnRK2.9-5. a Gene structure, blue blocks = untranslated region, red blocks = exon, black line = intron, M = DNA marker (100 bp). Scatter plot for KASP assays; showing clustering of accessions on the X—(FAM) and Y—(HEX) axes. Accessions colored blue have the FAM-type allele; accessions colored red have the HEX-type allele; black dots represent the NTC (non-template control). b KASP1 assay for SNP-308 nt shows allele “C” in FAM and allele “T” in HEX cluster. c KASP2 assay for SNP-1700 nt shows allele “C” in FAM and allele “A” in HEX cluster

