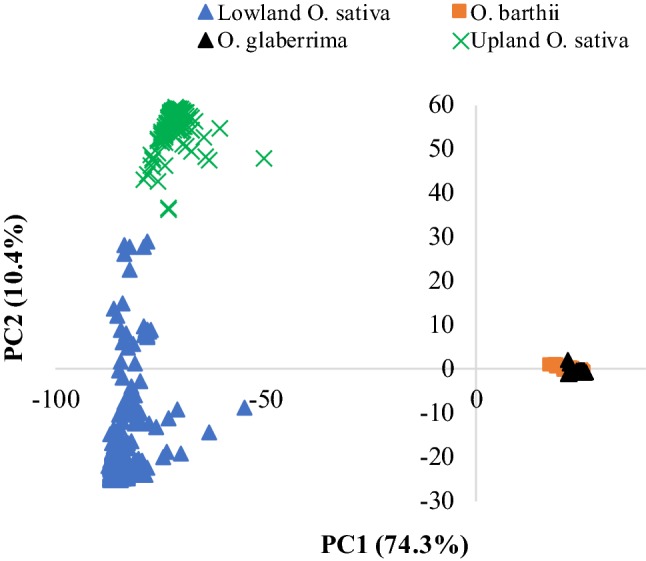
Fig. 1.

Plot of PC1 and PC2 from principal component analysis of 3245 samples representing Oryza glaberrima (2358), O. barthii (115) and O. sativa (772) using 23,079 polymorphic SNPs. As only 14.4% of the 23,079 SNPs were polymorphic between O. barthii and O. glaberrima, these two species appeared nearly identical, while O. sativa genotypes showed clear separation into upland (218) and lowland (554) ecologies
