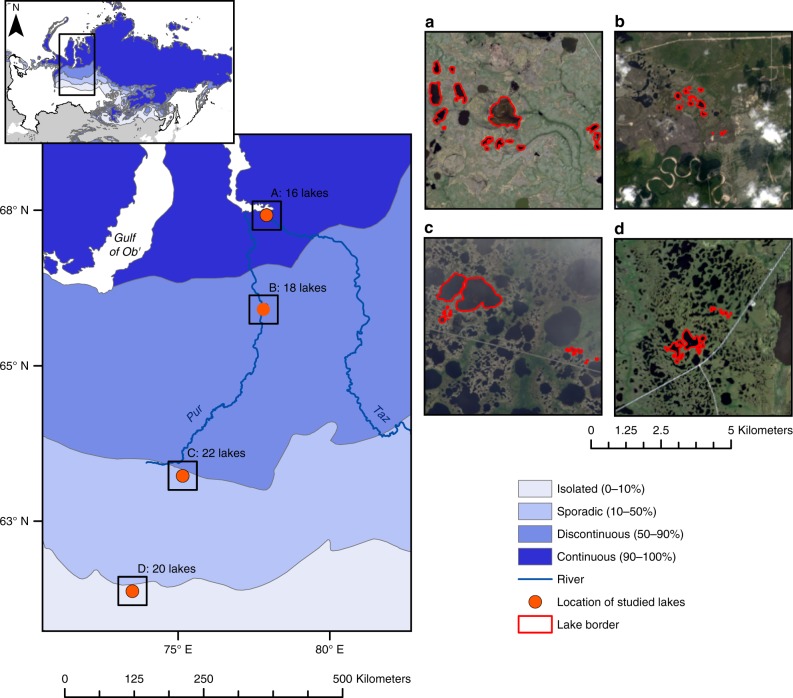
Fig. 1.
Map of the study area in the Western Siberia Lowland, Russia. Blue shading represents percent permafrost extent in the area of Western Siberia Lowland based on freely-available shapefiles from Brown et al.58. Orange dots indicate the location of the studied sites and red lines show shorelines of the studied lakes. Panel (a) refers to the site in the continuous permafrost zone, panel (b) to the discontinuous, panel (c) to the sporadic permafrost zone whereas panel (d) to the isolated permafrost zone. For details on satellite images acquisition see Ancillary data

