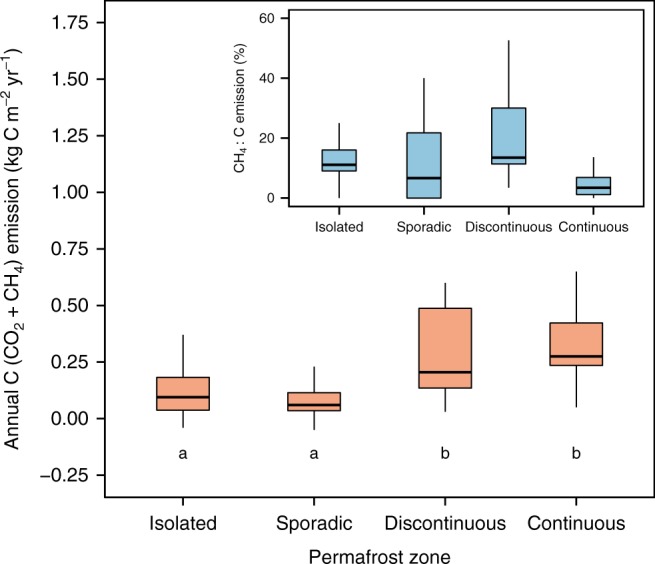
Fig. 3.

Annual C (CO2 + diffusive CH4) emission across different permafrost zones. Annual C emission is greater in colder permafrost-rich regions compared to warmer permafrost-poor regions (see Fig. 1 for the geographical location of different permafrost zones). The inset shows the percent of diffusive CH4 emission in annual C emission across different permafrost zones. Boxes are bound by 25th and 75th percentiles, whiskers show 1.5 interquartile range. Solid line represents median values. Positive values indicate outward flux from the lakes into the atmosphere. Permafrost zones that share a letter are not significantly different. We removed 3 outliers on the main plot and 5 outliers on the inset to visually improve the graph, but used the complete dataset for statistical analyses. For sample size see Supplementary Table 4
