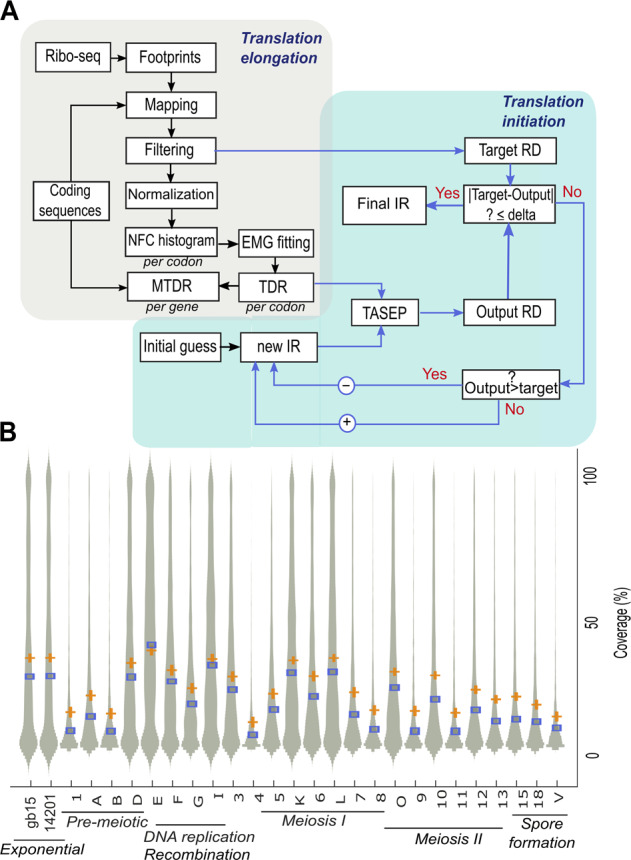
Fig. 1.

a Flow chart describing research approach: Ribo-Seq footprints at multiple time points were retrieved and mapped to the transcriptome. Positional RC profiles were generated and filtered. Each RC profile was normalized by its average RC, producing a transcript-specific NFC profile. For each codon, NFC values were collected from all NFC profiles, and per-codon histograms were generated. Using the MLE criterion, the histograms were fitted to an exponentially modified gaussian (EMG) distribution and the typical decoding rate of the codon was determined by the µ parameter. Finally, the MTDR of each gene was calculated by the mean of the typical decoding rates of its codons. Initiation rates were inferred using an optimization approach based on the totally asymmetric exclusion process (TASEP) model. The per-codon TDR and the ribosomal density were calculated based on the filtered ribo-seq profiles and ribosome occupancy data (details in the Methods). mRNA levels were calculated based on RNA-seq experiments performed at multiple time points along the yeast meiotic sporulation program.4 b Coverage of the RC profiles are shown on a violin plot. Values correspond to the raw sequencing data produced by Ribo-seq. Time points labels appear as in.4 Median values are denoted by blue squares and mean values by orange “+“ symbol
