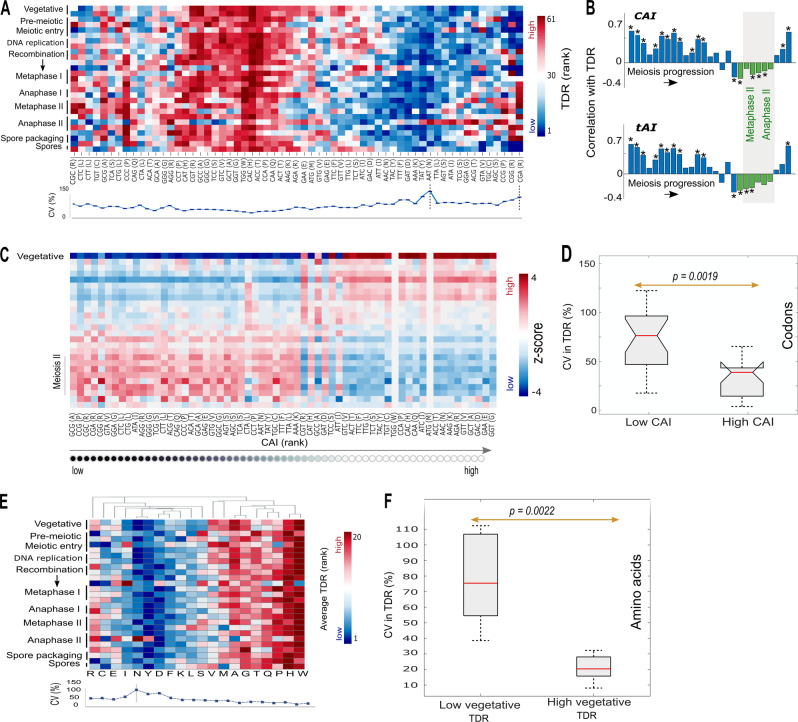
Fig. 2.
a Changes in codon decoding time during meiosis. Rows represent time points along sporulation and columns represent codons. To enable the comparison of TDR calculated at different time points, TDR are ranked at each time point. Blue and red entries correspond to low and high decoding rate, respectively. Codons are ordered according to a hierarchical clustering based on Euclidean distance. Below is the CV (%) corresponding to the relative variability in the TDR rank of each codon (“Methods” section). b Spearman’s rank correlations of codons’ TDR with CAI (top) and tAI (bottom) at each time point. Bars fall within meiosis II are colored in green and the area is shaded in gray. Significant correlations (p < 0.05) are designated by asterisks. c. The per-codon ratio between the total frequency of occurrences in all transcripts at vegetative growth, and at each other time point (Methods). Ratios are standardized per codon by the average over the time points. d Distribution of the CV in TDR of codons with the highest and lowest CAI; Methods). Medians are marked by horizontal red lines. P-value corresponding to the statistical difference between the medians is denoted. e Changes in the average TDR per-amino acid during meiosis. Rows represent time points along sporulation and columns represent amino acids. A dendrogram of the hierarchical clustering of the amino acids based on their average TDR pattern is shown above. f Distribution of the CV in TDR of amino acids with slow and high TDR at the vegetative growth time point. Medians are marked by horizontal red lines. P-value corresponding to the statistical difference between the medians is denoted. P-value remained significant after sampling equal number of RC for each codon (Supplementary Figure 2, Methods section)

