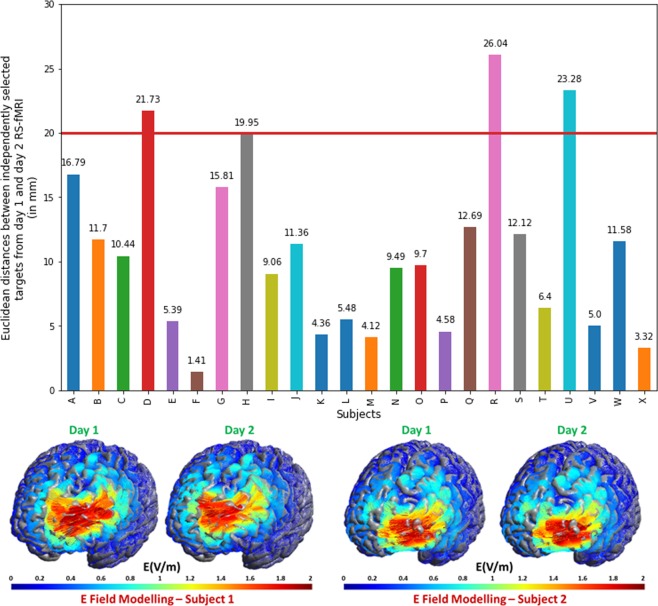
Figure 1.
Distances between targets from day 1 and day 2 rsfMRI (n = 24) and electric field modelling for two example subjects. Upper panel: Bar plot of Euclidean distance between targets from day 1 rsfMRI and targets from day 2 rsfMRI. 3 subjects have a distance larger than 20 mm. Lower panel: A qualitative description of electric field modelled (Thielscher et al., 2015) on the two targets from day 1 and day 2 rsfMRI data. A quick look reveals the similarity of the electric field when either of the targets are used.

