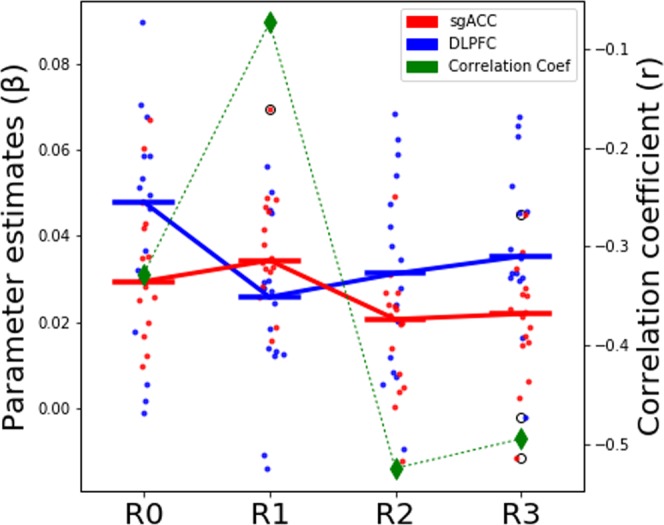
Figure 5.

Plotting the interaction of personalized left DLPFC with sgACC and DMN. The plot shows the parameter estimates of left DLPFC functional connectivity to IC-DLPFC network and that of sgACC to DMN. The bars represent the median value of the parameter estimates. The plot shows how left DLPFC changes in functional connectivity occur during R1 rsfMRI session. While the sgACC functional connectivity changes follow later during R2 rsfMRI session. The green dashed line plots the correlation coefficients (right y-axis) between the parameter estimates of left DLPFC and sgACC. It shows that the baseline negative correlation between left DLPFC and sgACC is reduced after stimulation in R1 rsfMRI session, followed by stronger negative correlation between the two regions during R2 and R3 rsfMRI sessions. Refer to legend for info on color coding.
