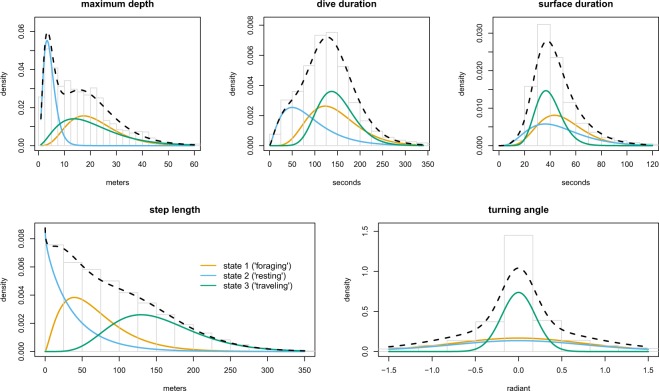
Figure 3.
Histograms of the movement variables maximum depth, dive duration, surface duration, step length, and turning angle, respectively, overlaid with the state-dependent distributions as estimated for these variables by the HMM. The state-dependent distributions were weighted according to the proportion of time spent in the different states, as inferred using Viterbi, and the dashed lines indicate the associated marginal observation distributions under the full model.

