Fig. 1.
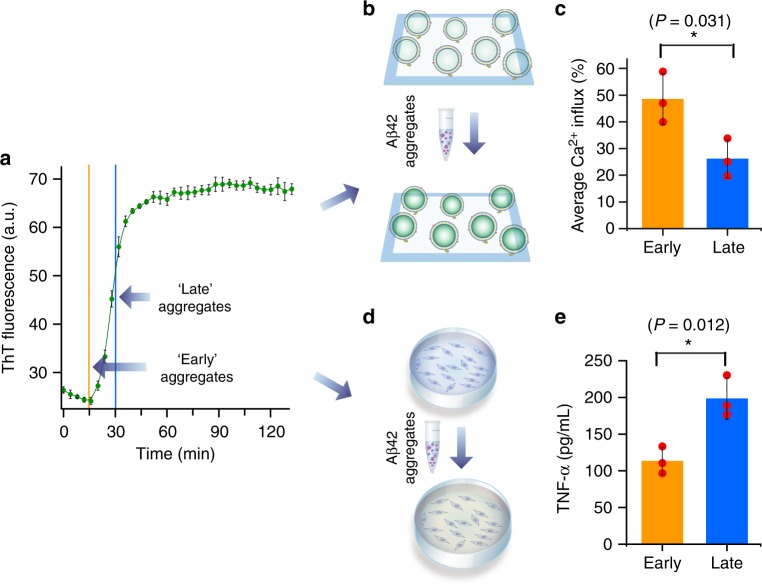
Soluble Aβ42 aggregates at different aggregation stages show different toxicity mechanisms. a The aggregation Aβ42 was monitored by ThT fluorescence. Each data point represents the mean of three independent biological repeats and its error bar the corresponding standard deviation. Aliquots containing Aβ42 aggregates were taken from the aggregation reaction at two different time points—at the end of the lag phase (15 min, for ‘early’ soluble aggregates) and at the midpoint of the growth phase (30 min, for ‘late’ soluble aggregates). b The lipid bilayer permeability induced by Aβ42 aggregates was measured by immobilizing on glass cover slides hundreds of nano-sized individual lipid vesicles in the presence of a Ca2+-sensitive dye. If the aggregates disrupt the integrity of the lipid bilayer, Ca2+ from the external medium enters into individual vesicles to a level that can be quantified using highly sensitive total internal fluorescence microscopy (TIRF) measurements. c Early Aβ42 aggregates cause a higher level of bilayer permeability than later Aβ42 aggregates. The data were averaged over three biological repeats, with each repeat involving the analysis of 6000 individual lipid vesicles, the error bars represent standard deviation, and the statistical significance was calculated using a two-sample t-test. d The inflammatory response in microglia was quantified using an ELISA assay to measure the levels of secreted tumour necrosis factor alpha (TNF-ɑ). e In contrast to the bilayer permeability assay, the late aggregates were more effective than the early aggregates. The data are averaged over three biological repeats, each repeat was averaged over three wells, each of which contained 200,000 to 300,000 BV2 cells, the error bars represent the standard deviation among the repeats, and the statistical significance was calculated using a two-sample t-test (unpaired). Data points for each biological replicate shown with red circles. Source data of a, c and e are provided as Source Data files. Aggregates used for the membrane permeability and the inflammation assays were collected from the same aggregation reaction

