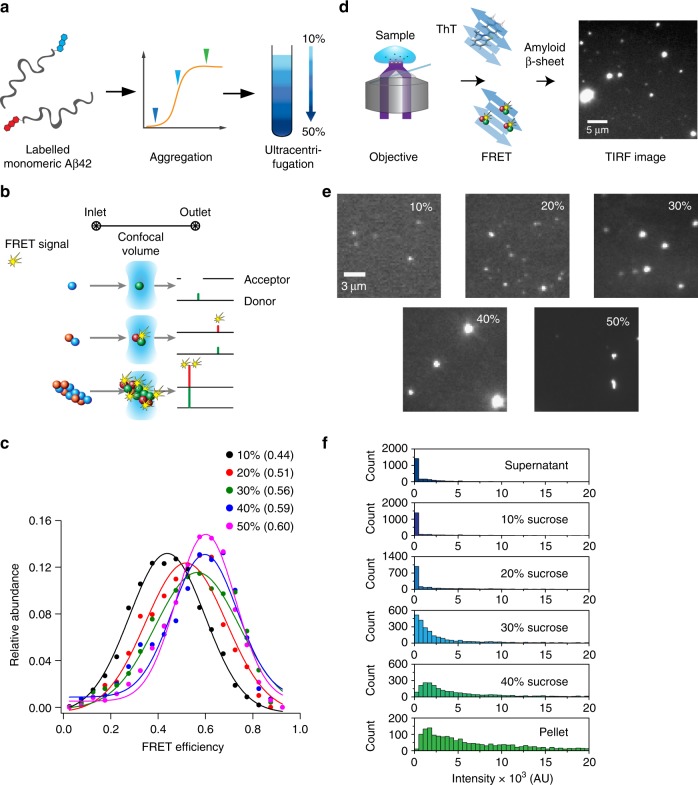
Fig. 5.
Single-particle characterization of the dye-labelled Aß42 aggregates, a Schematic representation of the separation workflow of the Aβ42 aggregates: solutions of dye-labelled monomeric Aβ42 were allowed to aggregate and aliquots removed at the different times described in Fig. 2 (shown as coloured triangles in the graph). The aggregated mixture collected at different time points was then loaded onto a sucrose step gradient that is divided into five fractions, and was subsequently used for experimental measurements. b Illustration of the confocal FRET experiment, showing a schematic of the microfluidic channel used to deliver the samples for measurement. The confocal volume of the excitation beam was set to the centre of the channel. Both the donor and acceptor channel intensities were recorded for every aggregate flowing through the excitation volume. c Maxima of FRET efficiency for increasing sucrose concentrations shifts towards higher FRET efficiencies indicates that size of the aggregates present in sucrose solution increases. Relative FRET efficiency for each sucrose concentration are fitted with Gaussian function (solid lines) to get the maxima (shown in parenthesis). d Schematic of the TIRF imaging for single-aggregate imaging. e Images of aggregates present in all five fractions are shown to represent the sizes detected through TIRF microscopy and are representative of the indicated fractions. The scale bar is 3 µm. The FRET histograms of the fractions show a clear shift from a very narrow, low-intensity distribution in the smaller fractions to a broader higher intensity distribution in the higher fractions and in the pellet. Each histogram is the sum of aggregates of 27 field of views measured in three repeats of a single gradient ultracentrifugation preparation. Source data of c and e are provided as a Source Data file

