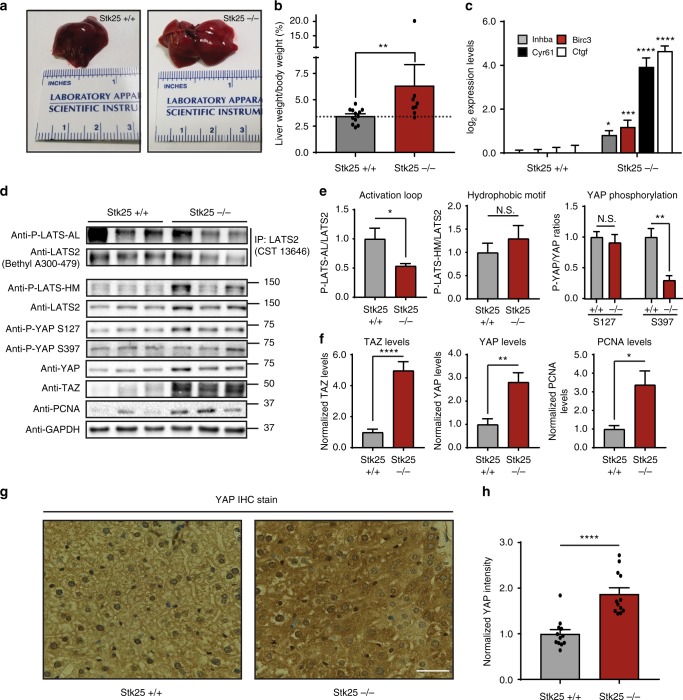
Fig. 6.
Loss of STK25 inactivates Hippo signaling in vivo. a Representative photographic images demonstrating gross morphology and size of livers dissected from STK25+/+ or STK25−/− mice. b Livers from STK25+/+ and STK25−/− mice were dissected and weighed; liver/body weight ratios were then plotted for analysis (n = 12 mice for STK25+/+ mice; n = 8 for STK25−/− mice. **p < 0.01, Mann–Whitney test). c qPCR analysis of validated YAP-target genes in the livers of STK25+/+ and STK25−/− mice (n = 3 biological replicates; *p < 0.05, ***p < 0.001, ****p < 0.0001, unpaired t-test). d Representative immunoblot of Hippo signaling components in the livers of STK25+/+ and STK25−/− mice. To probe for P-LATS-AL, endogenous LATS2 was first immunoprecipitated from tissue lysates and then re-analyzed via SDS–PAGE for phosphorylation status. e Quantitation of LATS phosphorylation and YAP phosphorylation in the livers of STK25+/+ and STK25−/− mice from d (n = 4 biological replicates, *p < 0.05, **p < 0.01, N.S. indicates “not significant,” unpaired t-test). f Quantitation of total protein levels of interest in the livers of STK25+/+ and STK25−/− mice (n = at least four biological replicates, *p < 0.05, **p < 0.01, ****p < 0.0001, unpaired t-test). g IHC staining for YAP was performed on sections of livers from STK25+/+ and STK25−/− mice. Representative ×40 images are presented here. Scale bar, 100 µm. h Quantitation of YAP staining intensity from g was performed and plotted for analysis (n = 4 biological replicates, each with three randomly chosen fields of view for quantitation; ****p < 0.0001, Mann–Whitney test). All data are presented as mean ± SEM

