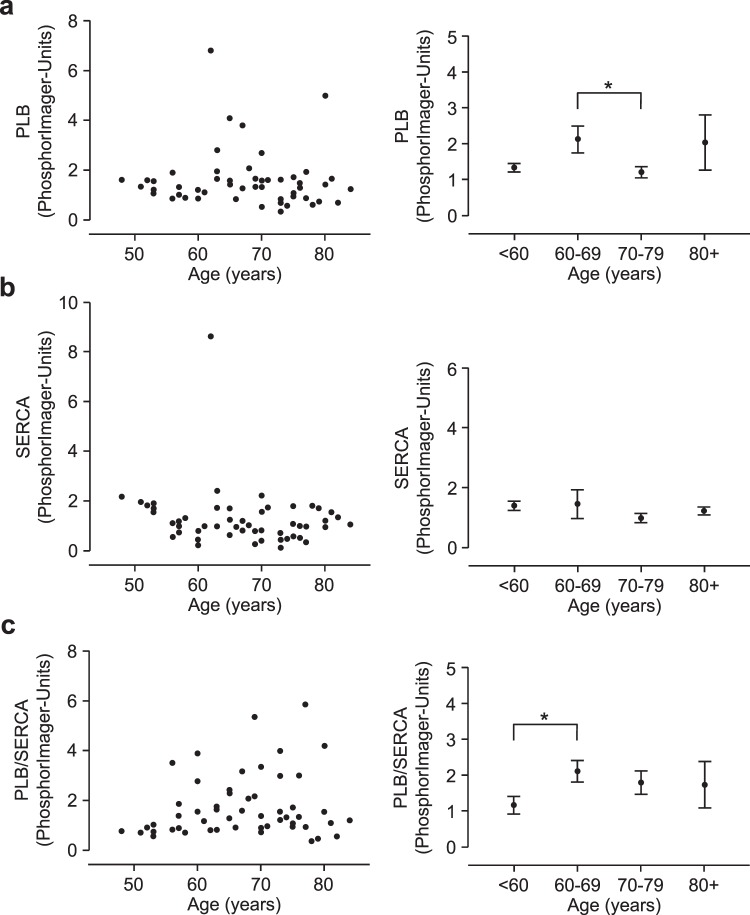
Figure 4.
Correlation of (a) PLB, (b) SERCA, and (c) the ratio of PLB and SERCA (PLB/SERCA) expression in human right atrium (left). Ordinates are protein expression (normalized to CSQ in arbitrary phosphorImager units) versus age (abscissae). Data on the right hand side give means of ten year intervals ± SEM. *Indicates a significant difference between age groups 70–79 vs. 60–69 (a) or below 60 vs. 60–69 (c). N(total) = 53, N(<60) = 12, N(60–69) = 17, N(70–79) = 19, N(80+) = 5.

