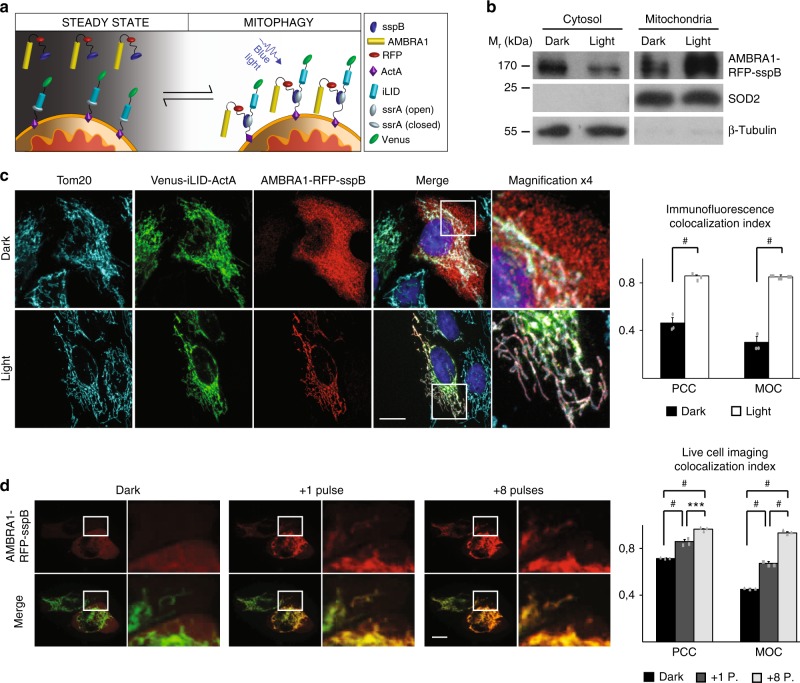
Fig. 1.
AMBRA1-RFP-sspB is relocalized to MOM upon blue light exposure. a Scheme of the blue light-dependent, AMBRA1-RFP-sspB-mediated induction of mitophagy. In resting conditions, Venus-iLID-ActA is tethered to the MOM, while AMBRA1-RFP-sspB is found in the cytosol (STEADY STATE panel, left). Upon blue light administration, iLID undergoes into a conformational change, which unmasks the ssrA peptide and permits the high-affinity binding between ssrA and sspB (MITOPHAGY panel, Right). Thus, the pro-autophagy protein AMBRA1 (covalently bound to sspB) accumulates to the edge of the MOM where it promotes autophagy-mediated clearance of mitochondria (mitophagy). b HeLa cells, transfected with plasmids encoding Venus-iLID-ActA/AMBRA1-RFP-sspB, were exposed to continuous blue light for 30 s or kept in the dark. Crude mitochondrial and cytosolic extracts were analyzed by WB through an anti-AMBRA1 antibody to reveal AMBRA1-RFP-sspB. SOD2 and β-tubulin were used as loading control for mitochondrial and cytosolic lysates, respectively. Mr (kDa): relative molecular mass expressed in kilodalton. c HeLa cells were transfected and treated as described in (b). Subsequently, cells were fixed and immuno-stained with antibodies against AMBRA1 (red) and Tom20 (MOM marker, cyan). The green signal shown in the figure is the intrinsic fluorescence of the Venus-iLID-ActA protein. Pearson’s correlation coefficient (PCC) and Manders’ overlap coefficient (MOC) of the red over the green signal were quantified in ten random fields of three independent experiments. Nuclei (blue) were stained with DAPI. d HeLa cells overexpressing Venus-iLID-ActA/AMBRA1-RFP-sspB were filmed through the UltraVox (PerkinElmer) live cell imaging spinning disk microscope before (Dark in the panel) and during 8 irradiation cycles, consisting of 1 pulse (50 ms) of blue light followed by 35 s of dark resting state. The graph shows PCC and MOC quantifications of the red over the green signal for three conditions (Dark, one pulse, eight pulses) in ten random fields of three independent experiments. Images are the sum of a three frames Z-stack. Insets: 4× magnification. Scale bars: 10 μm. Data shown: mean ± S.E.M. Hypothesis tests: Student’s t test in (c) and ANOVA test in (d). ***p < 10−3. #p < 10−4. Source data are provided as a Source Data file

