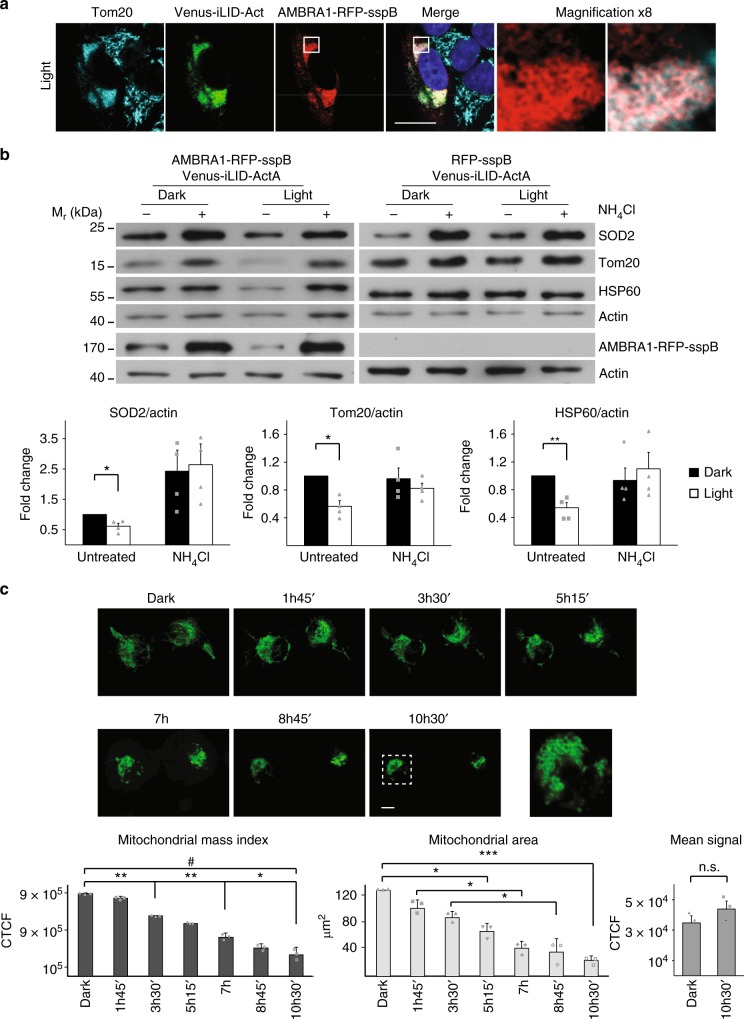
Fig. 2.
AMBRA1-RFP-sspB shuttling to the MOM induces mitophagy. a Venus-iLID-ActA/AMBRA1-RFP-sspB overexpressing HeLa cells were irradiated or not for 4 h with pulsed, blue light. Cells were subsequently fixed and stained for Nuclei (DAPI, blue), AMBRA1 (red) and Tom20 (cyan). Inset: 8× magnification. Scale bar: 10 μm. b HeLa cells, transfected with plasmids encoding Venus-iLID-ActA/AMBRA1-RFP-sspB (left panel), were stimulated with a blue LED irradiator or left in the dark for 24 h. In the meantime, they were treated or not with 40 mM NH4Cl, a lysosome inhibitor. As a negative control, the same experiment was repeated in Venus-ILID-ActA/RFP-sspB co-expressing cells (right panel). In the subsequent WB analysis, Tom20, SOD2, and HSP60 were used as mitochondrial markers, while actin was the loading control. AMBRA1-RFP-sspB was detected to verify the rate of overexpression. Graphs recapitulate the normalized ratio between the densitometric signals of the three mitochondrial markers over actin in four independent experiments involving Venus-iLID-ActA/AMBRA1-RFP-sspB overexpressing cells. For the quantification of the same parameters in the negative control see Supplementary Figure 7. Data shown: mean ± S.E.M. Hypothesis test: Student’s t test. *p < 5 × 10⁻². **p < 10−2. Mr (kDa): Relative molecular mass expressed in kilodalton. c Single-HeLa cells co-expressing Venus-iLID-ActA/AMBRA1-RFP-sspB were followed in time for 10 h 30 min during mitophagy progression through live cell imaging of the protein Venus-iLID-ActA (50 ms blue laser spikes alternated by 1 min dark). Each frame depicts mitochondria morphology every 1 h 45 min of stimulation. Images are the sum of a three frames Z-stack. Graphs show the area occupied by mitochondria over time, the overall reduction per whole cell of the Venus-iLID-ActA signal intensity corrected for the background and the mean fluorescence intensity in three independent experiments. Inset: 4× magnification of a single plane after 10 h 30 min of stimulation, highlighting mitoaggresome formation. CTCF corrected total cell fluorescence. Scale bar: 10 μm. Data shown: mean ± S.E.M. Hypothesis test: ANOVA test for Area and Mito Mass Index, Student’s t test for the mean signal. n.s. not statistically significant. *p < 5 × 10⁻². **p < 10−2. ***p < 10−3. #p < 10−4. Source data are provided as a Source Data file

