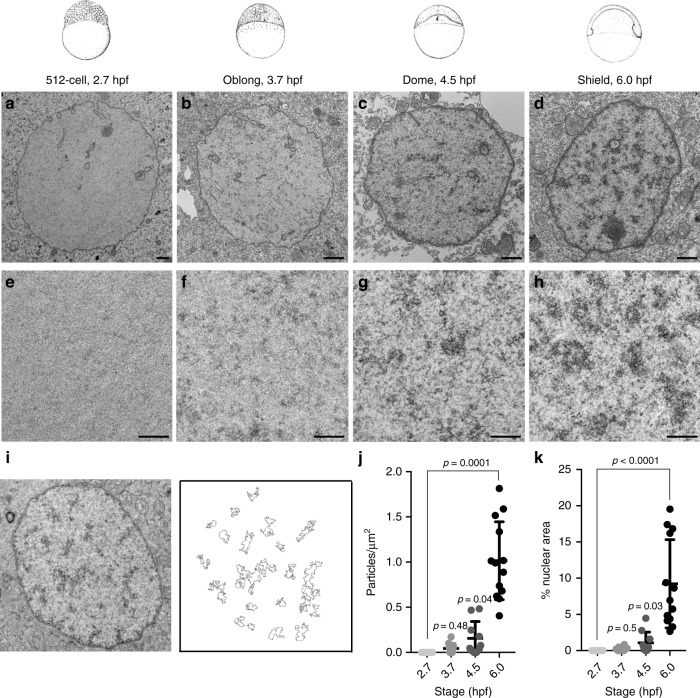
Fig. 2.
The early zebrafish embryo lacks condensed chromatin ultrastructure. Zebrafish embryonic stage schematics are reproduced from Kimmel et al.22 with permission from John Wiley & Sons Inc. a–h Transmission electron micrographs (TEMs) of representative nuclei from embryos at 2.7, 3.7, 4.5, and 6 h post fertilization (hpf). Images of representative nuclei at specified time points. e–h Higher magnification images (×20,000) of nuclear interior at specified time points. All scale bars (a–h) indicate 1 μm. i Representative image illustrating particle selection. j Quantification of the number of particles per nuclear μm2 in TEM images at 2.7, 3.7, 4.5, and 6 hpf. k Quantification of the percent nuclear area covered by particles in TEM images at 2.7, 3.7, 4.5, and 6 hpf. Nuclei from three embryos were assessed per time point, and electron-dense aggregates were quantified in four to six representative nuclei from each embryo. Each point represents data from one nucleus. P values were calculated using the Kruskal–Wallis test and corrected for multiple comparisons, error bars indicate standard deviation (SD)

