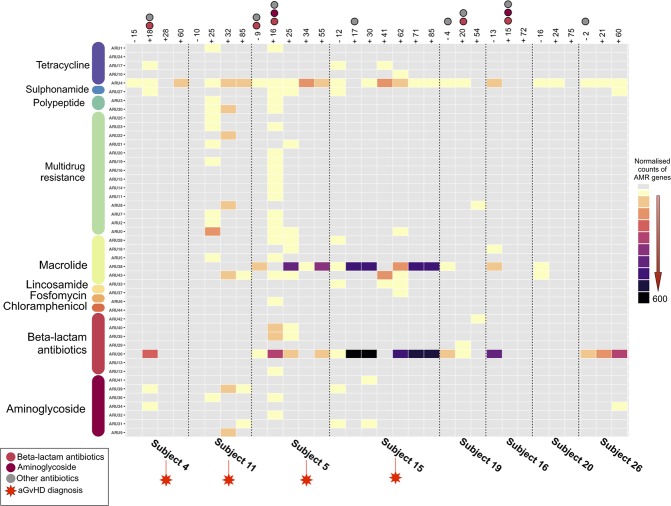
Figure 3.
ARUs trajectory over time in pediatric patients undergoing HSCT. Rectangles indicate the distribution of ARU abundances across time points for each subject, normalized by AMR gene count and represented with different colors, from gray (0 count) to black (600 counts). A black dotted vertical line is used to separate the sample sets of patients. aGvHD-positive subjects are highlighted with a red star. The presence of colored circles indicates the antibiotic intake during the specific time point (light red for beta-lactam antibiotics, dark red for aminoglycosides and gray for other antibiotics). Antibiotic Resistance Units (ARUs) are grouped by class of antibiotic, based on the assigned protein function.

