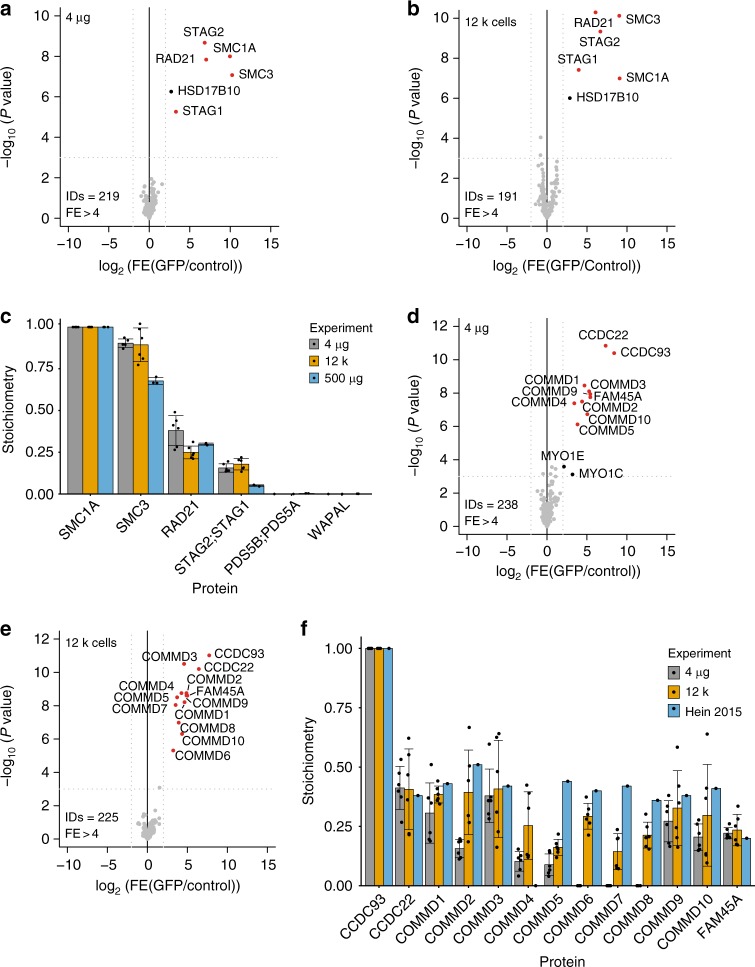
Fig. 2.
Benchmark for on-chip AP-MS on low amounts of total extract using SMC1A-GFP and CCDC93-GFP baits. a, b Volcano plots from label-free microfluidic pull-downs for SMC1A-GFP bait using 4 µg (a) or 12,000 cells (b). The enrichment of the bait and its partners as fold enrichment LFQ GFP over LFQ control (x-axis) is plotted against the −log10 transformed P value of the permutation based FDR corrected t test (y-axis). ID refers to the total number of proteins reported and FE stands for fold enrichment. Dotted gray lines represent statistical cut-offs. Black dots identify significant proteins; red dots are significant proteins that are known interactors of the bait. HSD17B10 is a known contaminant of pull-downs using Dynabeads®33. Each volcano plot presents n = 2 biologically independent experiments, each comprised of n = 3 technical replicates for PI-GFP and control extract. c Stoichiometry of the Cohesin subunits as compared to SMC1A for the experiments shown in panels a and b, as well as a 500 µg microcentrifuge tubes-based pull-down shown as gold standard (data from Supplementary figure 1a). iBAQ values for each of the interaction partners of Cohesin were divided by the iBAQ values of the bait, so that is set to 1. Data display mean values ± s.d. Gray bars represent the stoichiometry of Cohesin complex as derived from for the 4 μg input experiment, yellow bars for the 12,000 cells input experiment and light blue bars for the 500 μg input microcentrifuge tubes-based pull-down. Black dots represent the individual data points. d, e Volcano plot from microfluidic pull-down for CCDC93-GFP bait using 4 µg (d) and 12,000 cells (e). Dotted gray lines represent statistical cut-offs. Black dots identify significant proteins; red dots are significant proteins that are known interactors of the bait. MYO1E and MYO1C are known contaminants33. ID refers to the total number of proteins reported and FE stands for fold enrichment. Each volcano plot presents n = 2 biological replicates, each comprised of n = 3 technical replicates for PI-GFP and control extract. f Stoichiometry of the CCC complex subunits as compared to CCDC93 for the experiments shown in panels (d) and (e), using the pull-down performed by Hein et al.10 as reference. iBAQ values for each of the CCC interaction partners were divided by the iBAQ values of the bait (set to 1). Data display mean values ± s.d. Gray bars represent the stoichiometry of CCC complex as derived from the 4 μg experiment, yellow bars for the 12,000 cells experiment and light blue bars for microcentrifuge tube-based pull-down performed by Hein et al.10. Black dots represent the individual data points. Source data are provided as a Source Data file

