Fig. 4.
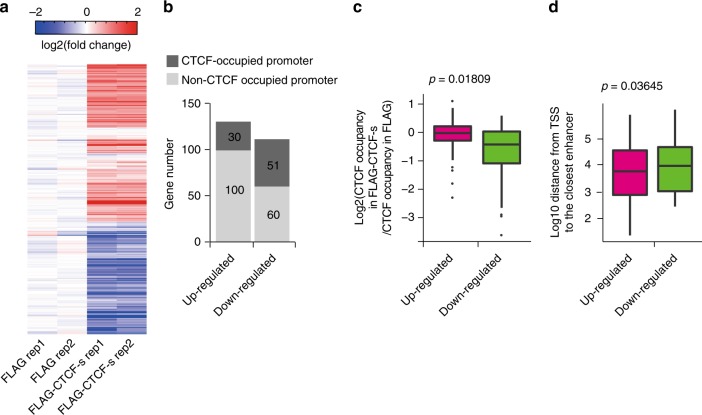
CTCF-s/CTCF competition and transcriptional regulation. a Hierarchical clustering of differentially expressed (DE) gene profiles after overexpression of FLAG-CTCF-s in HeLa-S3 cells. Fold-change was relative to the mean of the FLAG control. b Analysis of CTCF binding at promoters of DE genes, from panel (a). c CTCF-s downregulated genes tended to have decreased CTCF binding at their promoter regions. The center line represents the second quartile, the bounds of box represent third quartile and first quartile. The whiskers indicate 1.5 × interquartile range and dots represent outliers. d Upregulated genes by CTCF-s tended to have enhancers that were closer to the TSS than downregulated genes. The center line represents the second quartile, the bounds of box represent third quartile and first quartile. The whiskers indicate 1.5 × interquartile range and dots represent outliers. The statistical significance for the boxplots in (c, d) was assessed by Wilcoxon rank sum test

