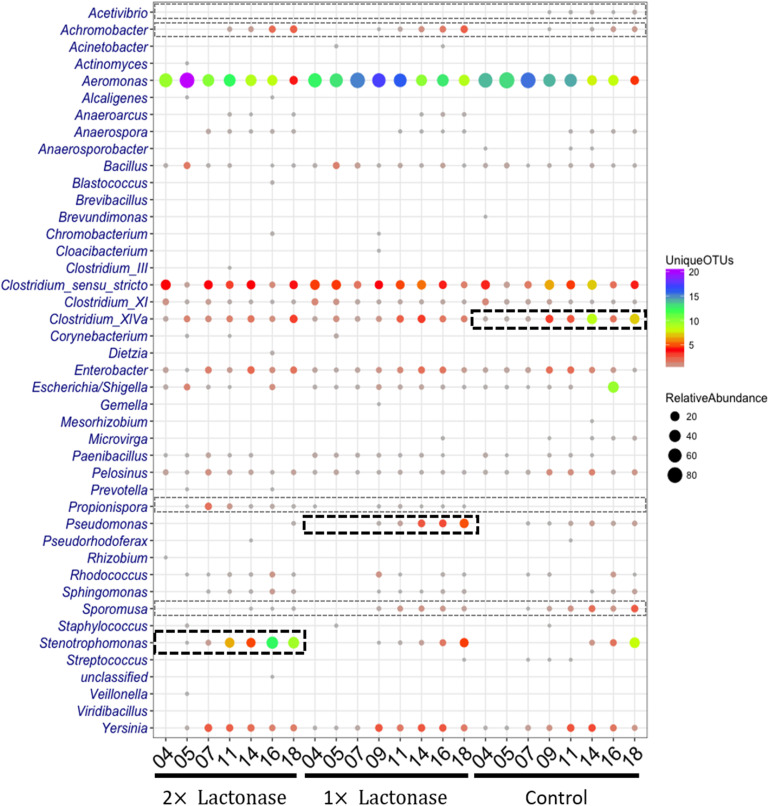
FIGURE 6.
The shift of relative abundance and diversity of bacterial taxa as a function of lactonase concentration and time at the genus level. The color represents the number of unique OTUs and the size of the circles is propositional to the total number of sequences for each given taxonomic group and sample. Abundant and less abundant genera showing difference in the bioreactors are shown in bold black-hashed boxes and light gray hashed boxes, respectively.

