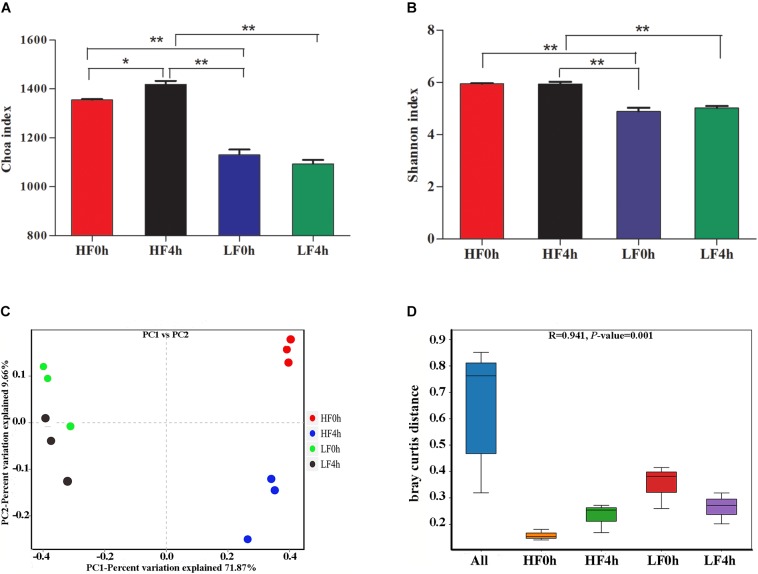
Figure 1.
(A) Chao 1 indices of alpha diversity base on OUT level. (B) Shannon indices of alpha diversity base on OUT level. (C) Beta diversity: principal coordinate analysis (PCoA) of bacterial community structure based on Buray–Curtis distances for two treatments of before and after feeding. (D) ANOSIM analysis of bacterial community structure based on Buray–Curtis distances for two treatments of before and after feeding. ∗(0.01 < P < 0.05); ∗∗(P < 0.01).

