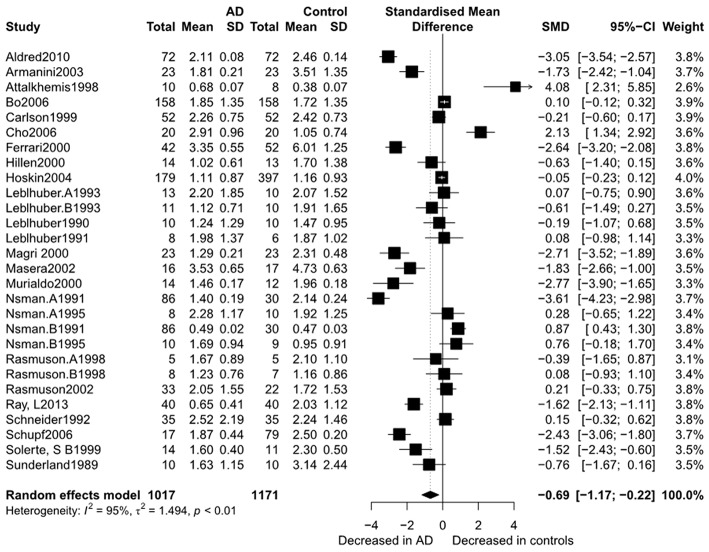
Figure 3.
Forest plot of DHEA-S between AD participants and controls. Study effect sizes of DHEA-S differences between Alzheimer's disease and controls. Each data marker represents a study and the size of the data marker is proportional to the total number of individuals in that study. The summary effect size for each DHEA-S is denoted by a diamond. AD, Alzheimer's disease; SMD, standardized mean difference.

