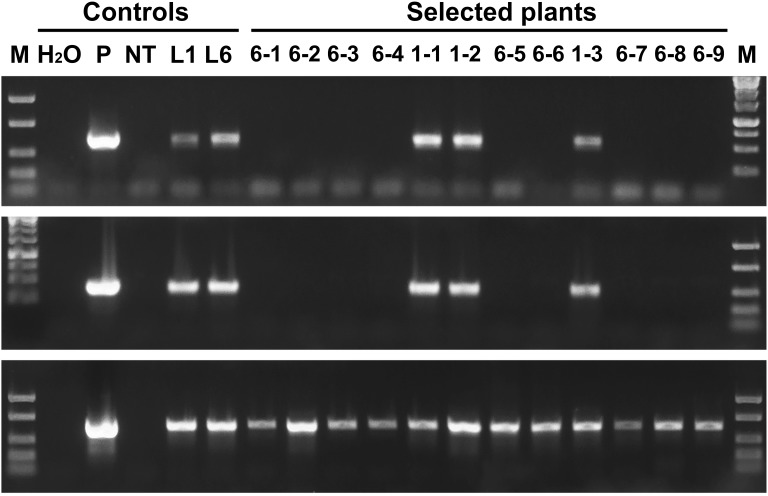
FIGURE 3.
Molecular analysis of apple plants after recombinase induction. Polymerase chain reaction analysis using specific primers for codA (upper panel), nptII (middle panel) and thauII (bottom panel). M, molecular weight marker; H2O, water; P, plasmid pMF-E8; NT, non-transgenic plant; L1 and L6, primary transgenic lines; other numbers, obtained sublines, the first number indicates from which line the plant was derived.

