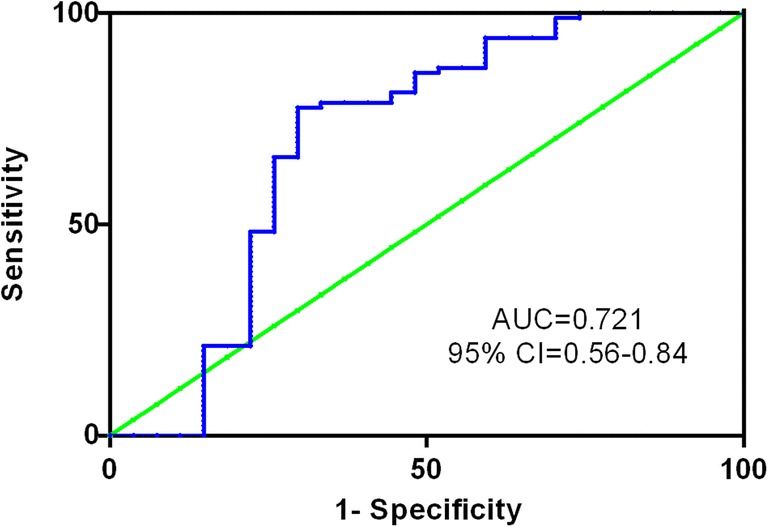
Fig. 2.

Receiver operating characteristic (ROC) curve analysis of BCL3 expression for discriminating AML patients from controls. ROC plots of BCL3 expression demonstrated the area under the curve (AUC) of 0.721 (95%CI:0.5922–0.85; P < 0.001) with 97.6% sensitivity and 55.6% specificity
