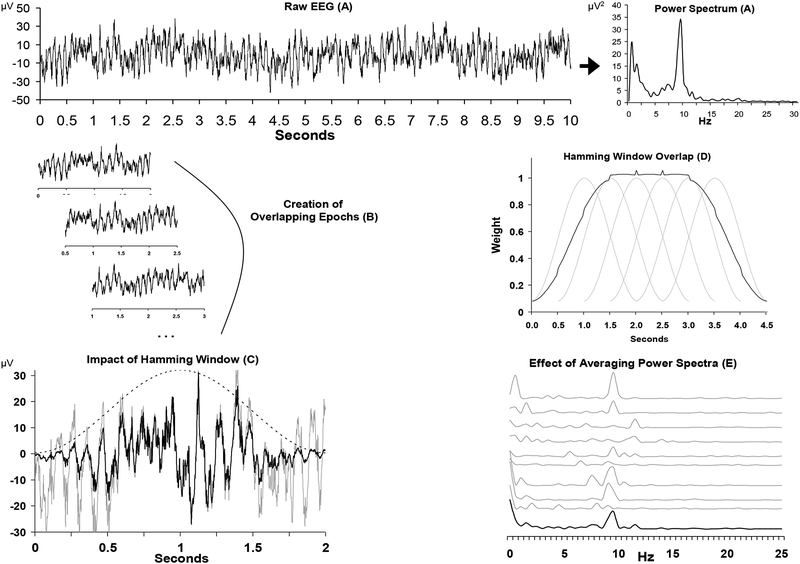
Figure 2.
Overview of converting time-domain signals to power spectra for EEG asymmetry research. Panel A depicts a 10-second segment of raw data from a single channel on the left, and the spectral representation of this epoch on the right. Panel B illustrates the process of epoching the longer segment into shorter overlapping two-second epochs. Panel C shows the impact of the Hamming window (dotted bell curve) on a single epoch, with the grey line representing the raw signal and the black line representing the signal after the application of the window. Note that a discontinuity would result if a copy of the raw (grey) signal were concatenated following this signal, but no such discontinuity would result for a similarly concatenated windowed (black) signal. Panel D displays the net weighting (black line, scaled to fit graph) of overlapping hamming windows (grey lines) for two-second epochs. Panel E illustrates the impact of averaging power spectra. The top 9 grey lines are the spectral representation of 9 two-second epochs, and the lower black line is the average spectrum. Note that alpha power (8–13 Hz) is somewhat variable from epoch to epoch, but that the average spectrum reveals a distinct alpha peak. Vertical axis in Panel E is power in microvolts-squared. Figure after Allen, Coan, and Nazarian (2004).

