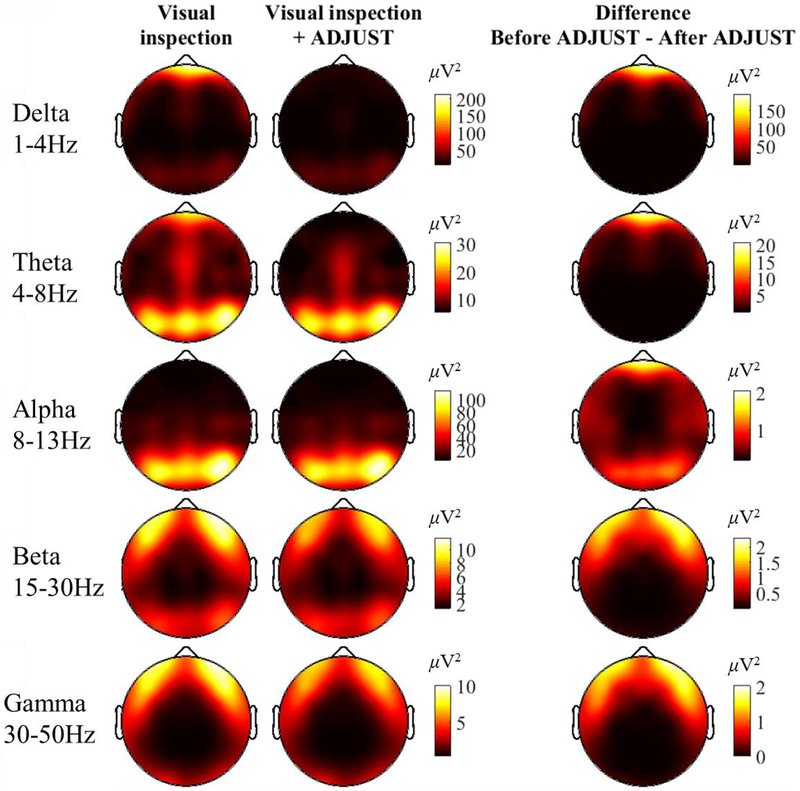
Figure 3.
Spectral power across the scalp for five frequency bands of interest before and after automatic IC-based correction using the ADJUST algorithm. The depicted scale (inμV2) varies across frequency bins, and is the same for the first two columns (Visual inspection only, Visual inspection only + ADJUST; the difference score has its own scale)). Overlapping-epochs were hamming-windowed prior to FFT to mitigate edge-artifacts. The FFT results for each epoch were averaged for each subject, then across all subjects (i.e., a grand-average). Spectral points were averaged within canonical frequency bands.

