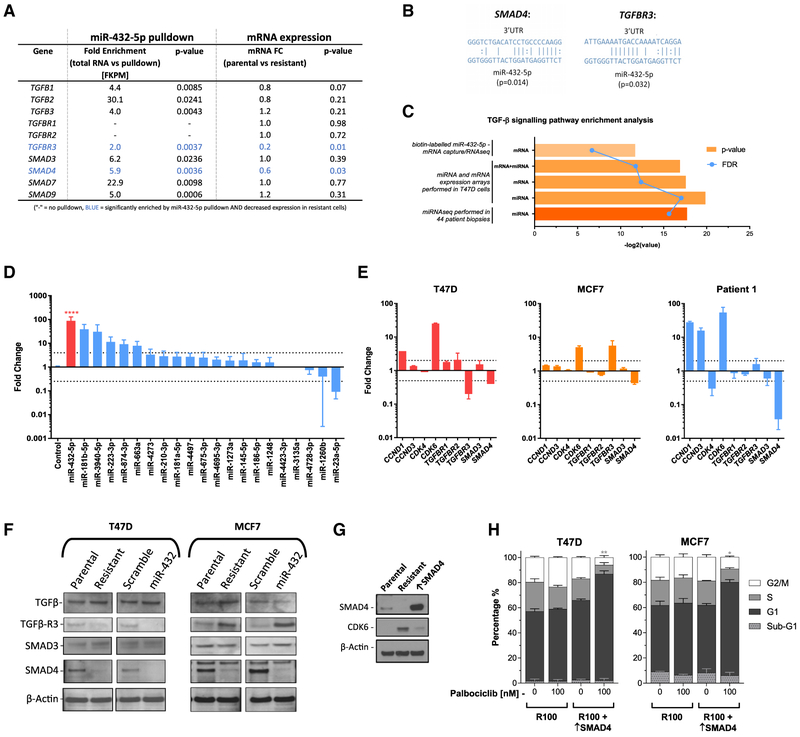
Figure 6. miR-432-5p Expression Is Significantly Higher in a Post-CDK4/6 Inhibitor-Treated Biopsy and Reduces TGF-β Pathway Signaling via Downregulation of SMAD4.
(A) Biotin-labeled miRNA-432-5p was used for mRNA pull-down in parental T47D cells. Fold enrichment is expressed relative to control RNA and correlated with mRNA expression data. Each experiment was performed in triplicate.
(B) Predicted miRNA binding of SMAD4 and TGFBR3 3′ UTR.
(C) GeneGo pathway enrichment analysis was performed on multiple datasets to compare enrichment in resistant versus sensitive patient biopsies (miRNA-seq), resistant versus sensitive T47D cells (whole-genome mRNA and miRNA arrays), and miRNA:mRNA capture versus total RNA (biotin-labeled miR-432-5p mRNA capture followed by RNA-seq).
(D) miRNA expression analysis was carried out by real-time qPCR from patient tumor biopsies pre-and post-CDK4/6 inhibitor (ribociclib) treatment. miRNAs were ranked based on the fold change in the post-treatment biopsy. Data are reported as the means ± SEMs of 3 independent experiments. ****p < 0.0001.
(E) Fold change in the mRNA expression of select genes in resistant cells and the post-CDK4/6 inhibitor treatment biopsy. Data are reported as the means ± SEMs of 3 independent experiments.
(F) Western blot showing the protein levels of TGF-β pathway components in parental, resistant, miR-scramble, and miR-432-5p expressing T47D and MFC7 cells.
(G) Confirmation of SMAD4 overexpression in resistant T47D cells by western blot.
(H) Cell-cycle analysis of SMAD4 overexpressing (↑SMAD4) palbociclib-resistant T47D cells. Data are reported as the means ± SEMs of 3 independent experiments. *p < 0.05, **p < 0.01. Indicated significance is between G1 populations of R100 versus R100 + ↑SMAD4.

