Figure 2.

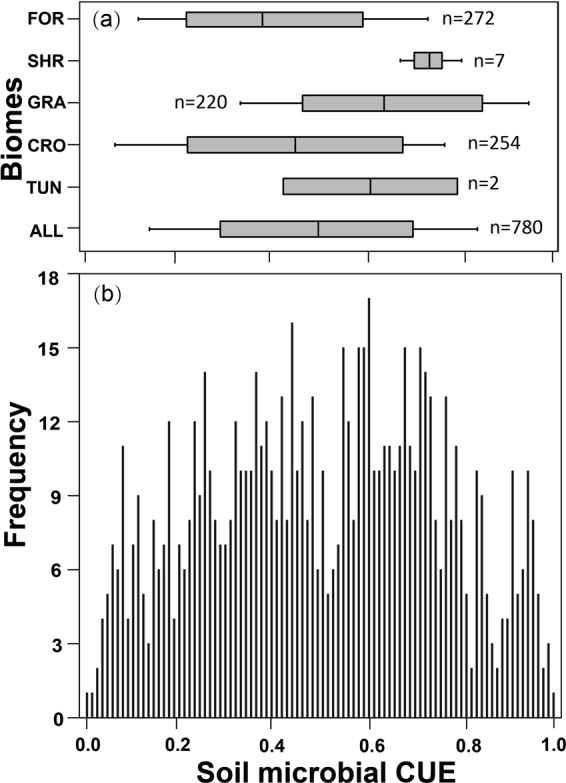
The mean CUE of different plant functional types (PFTs, a) and the frequency of CUE values at the global scale (b). FOR: Forest, SHR: Shrublands, GRA: Grasslands, CRO: Croplands, TUN: tundra, ALL: the mean CUE at the global scale.

The mean CUE of different plant functional types (PFTs, a) and the frequency of CUE values at the global scale (b). FOR: Forest, SHR: Shrublands, GRA: Grasslands, CRO: Croplands, TUN: tundra, ALL: the mean CUE at the global scale.