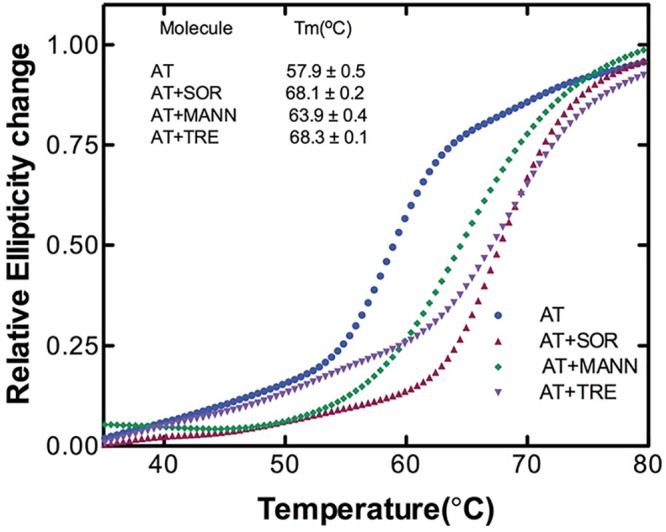
Figure 2. Stability of AT in the absence and presence of small molecules.

Relative ellipticity change at 222 nm is plotted against temperature over the range of 35–80°C of 3 µM of AT in the absence and presence of 1 M trehalose, 1.5 M sorbitol and 1.5 M mannose as described in methods. Relative ellipticities were calculated by using the relation [θobs− θmin]/[θmax −θmin] [38] where θmin and θmax were fitted values of ellipticity at the lowest and highest temperatures used in the study, respectively, and θobs is the observed ellipticity at temperature T. Each curve is an average of three experiments.
