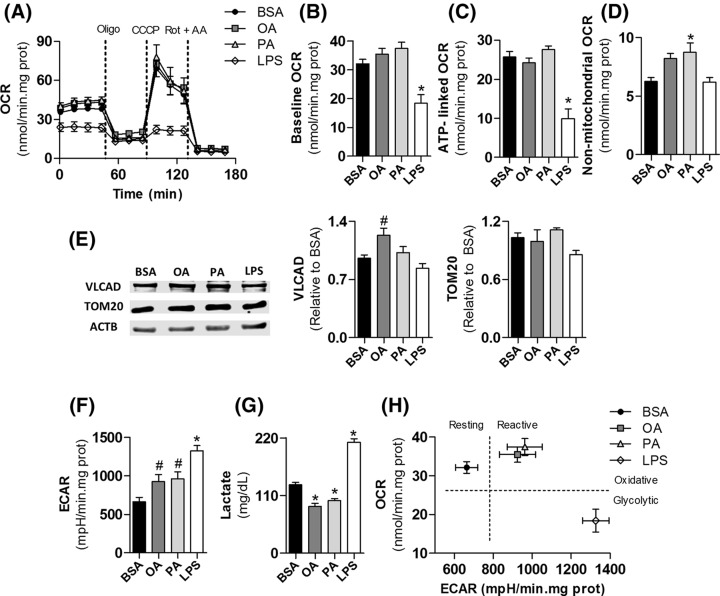
Figure 2. Microglial activation by palmitate and oleate is sustained by oxidative metabolism, while LPS activation is glycolytic.
BV2 cells were treated for 24 h with 0.25% (37.8 µM) BSA, 200 µM oleate, 200 µM palmitate or 1 µg/ml LPS followed by real time metabolic measurements. (A) Real time OCR. Baseline respiration was modulated by sequential additions of 1 µg/ml Oligo, 2 µM CCCP, and 1 µM Rot plus 1 µg/ml AA. (B) Microglial mitochondrial baseline respiration, (C) ATP-linked respiration, and (D) non-mitochondrial oxygen consumption. (E) Representative bands and quantification by densitometry of SDS–PAGE Western blots of BV2 cells lysates in different treatments, (F) basal ECAR, and (G) extracellular lactate accumulation. (H) Microglial metabolic phenotyping. Baseline OCR and ECAR values were used to depict metabolic states. Values represent averages ± SEM from four (A–F) or five (G) independent experiments and were compared using one-way ANOVA followed by Tukey’s post test. *P<0.05 vs BSA. #P<0.05 vs LPS.
Abbreviations: AA, antimycin A; OA, oleate; Oligo, oligomycin; PA, palmitate; Rot, rotenone.

