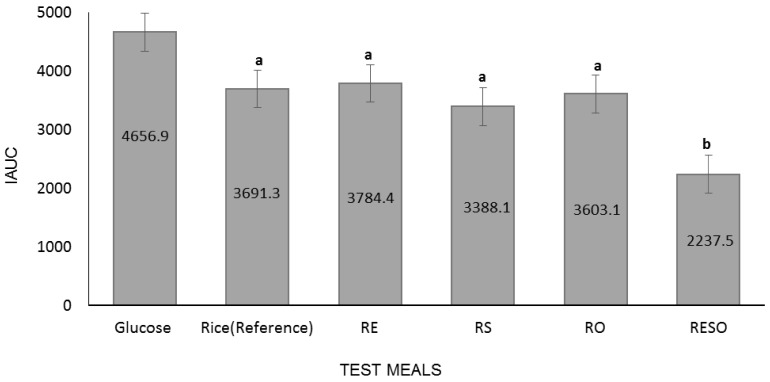
Fig. 1. Incremental area under the curve (iAUC) for participant-consumed test meals (different letters indicate significant differences between meal iAUC values; Wilcoxon signed-rank test, P < 0.05; n = 12, 6 men and 6 women).
RE, Rice+ egg; RS, Rice+ bean sprouts; RO, Rice+ oil; RESO, Rice+ egg+ bean sprouts+ oil.

