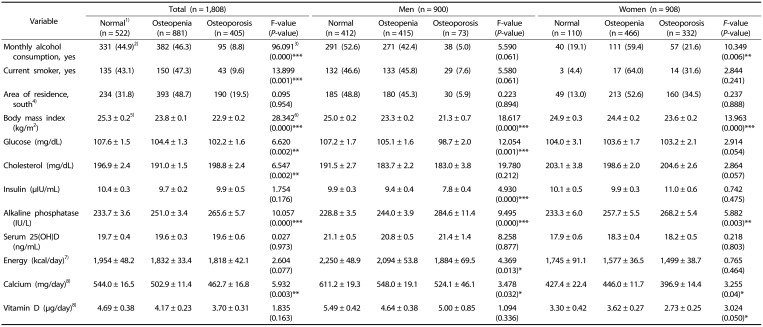
Table 1. Baseline characteristics of the participants according to bone mineral density.
1)Bone health status: normal (T-score ≥ −1), osteopenia (T-score < −1 and > −2.5), and osteoporosis (T-score ≤ −2.5)
2)n (%)
3)Significantly different within groups in the complex sampling chi-square test (χ2-value); **P < 0.01, ***P < 0.001
4)South: Jeollanam-do, Gyeongsangnam-do, Jeju, Daegu, Gwangju, Busan, and Ulsan
5)Mean ± SE
6)Significantly different in the complex samples general linear model; *P < 0.05, **P < 0.01, ***P < 0.001
7)All variables were adjusted for age and sex in all subjects collectively and for age in men and women.
8)Calcium and vitamin D intakes were adjusted for energy intake and age in men and women and adjusted for energy intake, age, and sex in all subjects collectively.

