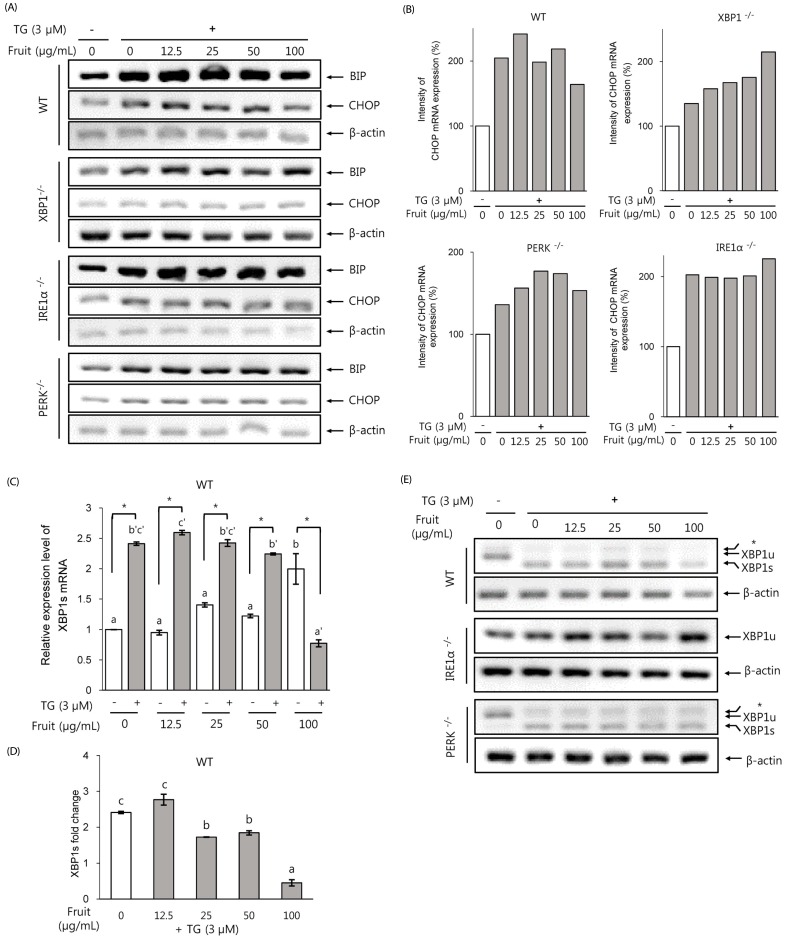
Fig. 5. Effect of LF on the ER stress in MEF cells.
MEF cell lines were pretreated with LF for 24 h, followed by 3 µM TG for additional 4 h (A, B) or 1 h (C, D and E). Total RNA was extracted and cDNA prepared for RT-PCR (A and E) and real-time qPCR (C, D). Mouse CHOP, XBP1s mRNA expression were normalized by mouse β-actin (B, C and D); CHOP mRNA expression was quantified using the ImageJ software (B). The experiments were performed individually at least three times. Data are expressed as mean ± SD. Significant differences between the different concentrations were analyzed by One-way ANOVA. The TG effect at each concentration was analyzed by student's t-test. *P < 0.05. BiP, Immunoglobulin binding protein; CHOP, CCAAT/enhancer-binding homologous protein; XBP1s, X-box binding protein 1 spliced form.

