
Figure 3.
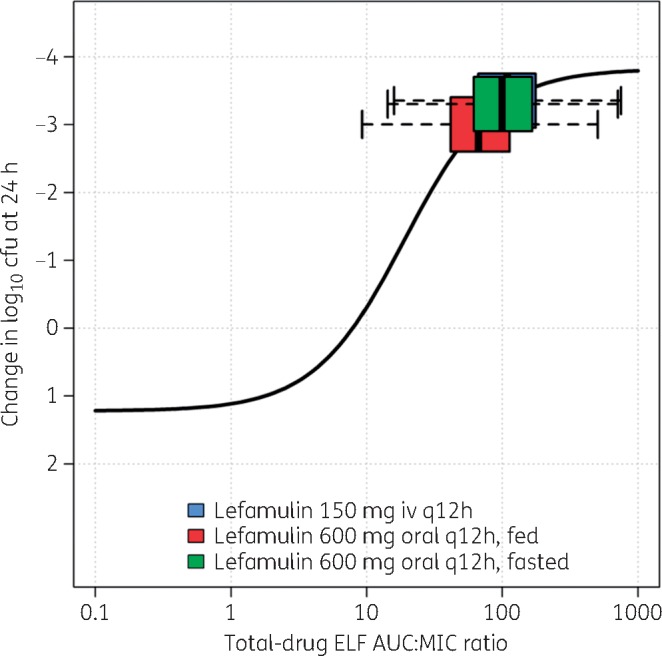
Non-clinical PK/PD relationship for efficacy for S. pneumoniae, overlaid with box-and-whisker plots of total-drug ELF AUC:MIC ratios for simulated patients after administration of lefamulin iv and oral dosing regimens. Horizontal box-and-whisker plots of total-drug ELF AUC:MIC ratios for simulated patients after iv and oral (under fed and fasted conditions) dosing regimens are shown overlaid on the PK/PD relationship based on data from a neutropenic murine-lung infection model for S. pneumoniae. For each boxplot, the edge of the box represents the 25th and 75th percentiles of the distribution for total-drug ELF AUC:MIC ratio. The line within the box represents the median total-drug ELF AUC:MIC ratio. The whiskers extend to the nearest value among those represented by 1.5 × IQR of the box edges, where IQR is the distribution of total-drug ELF AUC:MIC ratio from the 25th to the 75th percentiles. Note: the box-and-whisker plot for the distribution of total-drug ELF AUC:MIC ratios for lefamulin 150 mg iv q12h shown in blue is obscured by that for lefamulin 600 mg orally q12h administered under fasted conditions, shown in green.