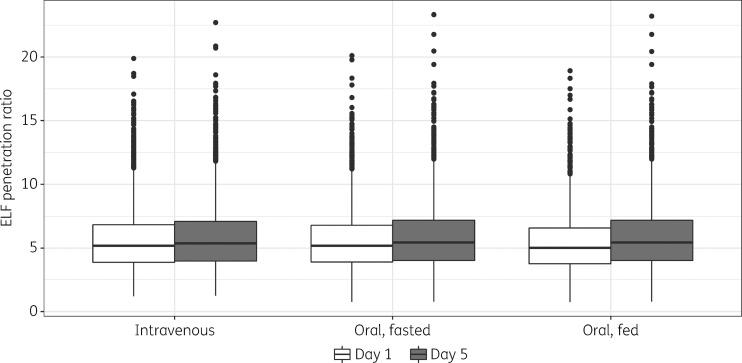
Figure 4.
Comparison of simulated lefamulin penetration ratio in the ELF on days 1 and 5 of treatment, by route of administration and fed status. Solid line in the middle of the box represents the median, box limits are the IQR, vertical lines (whiskers) extend to ±1.5 × IQR, and solid circles represent values outside the whiskers.

