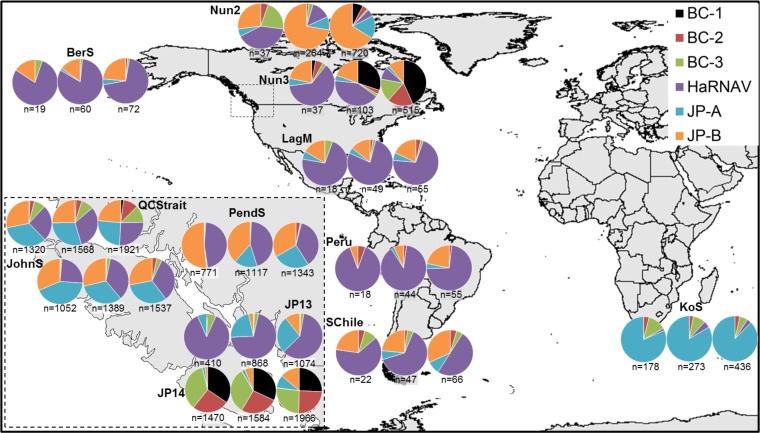
FIG 3.
Distribution of six marine RNA virus genomes. Charts represent the number of reads recruited to each genome at 95, 85, and 75% protein identity with the number of total reads recruited below each chart. Genomes are represented by colors for marine RNA viruses BC-1 (black), BC-2 (red), BC-3 (green), JP-A (blue), JP-B (orange), and Heterosigma akashiwo RNA virus (purple). Metagenomic data sets were selected based on high percentage amino acid identity read recruitment to the six viruses and include the Bering Sea (BerS), Nunavut 2/3 (Nun), Laguna Madre (LagM), Peru, South Chile (SChil), Kenton-on-Sea (KoS), Queen Charlotte Strait (QCStrait), Pendrell Sound (PendS), Johnstone Strait (JohnS), and Jericho Pier 13/14 (JP).

