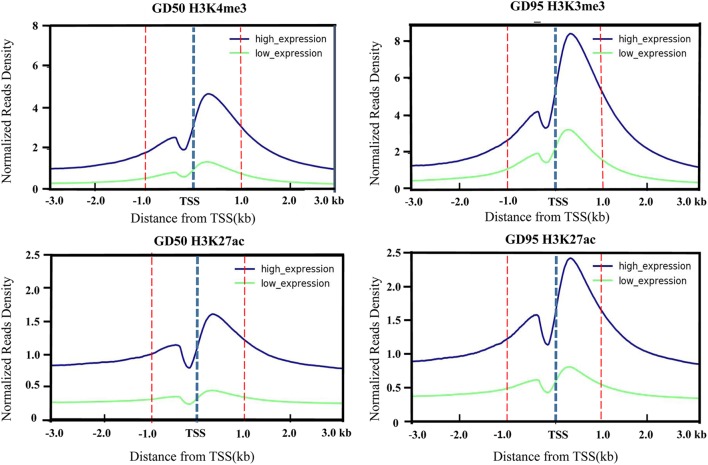
FIGURE 3.
Profiles of the H3K4me3 and H3K27ac around TSS that were generated according to gene expression level. The H3K4me3 and H3K27ac signal densities were calculated as H3K4me3 and H3K27ac RPKM. Low-level and high-level expressed genes are represented by green and blue lines, respectively. GD50, day 50 of gestation; GD95, day 95 of gestation.

