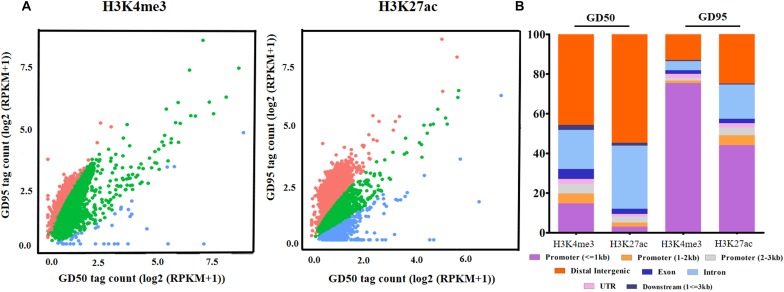
FIGURE 5.
The altered H3K4me3 and H3K27ac modification regions in porcine placentas. (A) Changes of genome-wide H3K4me3 and H3K27ac histone modification statuses. The difference in signals between days 50 and 95 of gestation was evaluated by the scatter plot of log2 (RPKM +1). Red dots represent regions with increased signals of H3K4me3 and H3K27ac on day 95 of gestation. Blue dots represent regions with decreased signals of H3K4me3 and H3K27ac on day 95 of gestation. Green dots represent unchanged H3K4me3 and H3K27ac modification regions in placentas between days 50 and 95 of gestation. (B) The distribution of the differential histone modification regions in different genomic regions. GD50, day 50 of gestation; GD95, day 95 of gestation.

