FIGURE 7.
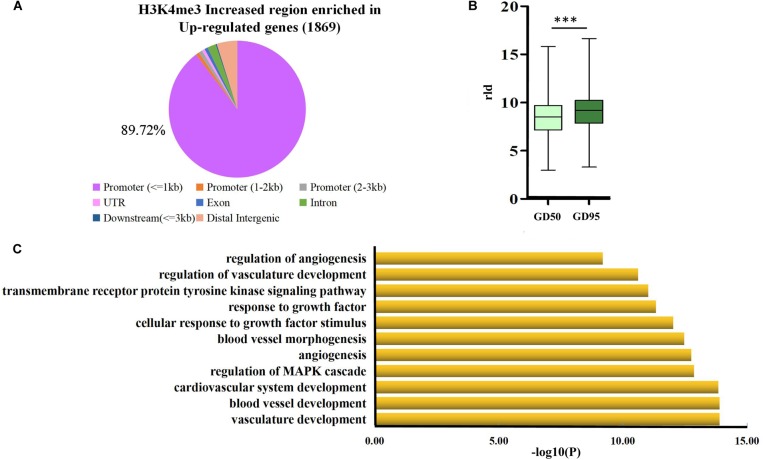
Analysis of the H3K4me3-increased region that were enriched in the proximal promoter region (≤1 kb) of up-regulated genes (A) genome-wide distribution of the increased signals of H3K4me3 that were found to be enriched in up-regulated genes (1,869 genes). (B) Box plot of rld expression value of genes that were up-regulated and affected by H3K4me3. ∗∗∗P < 0.001 (C) Gene ontology analysis of the up-regulated genes that were associated with the increase of H3K4me3 in the proximal promoter region (≤1 kb). GD50, day 50 of gestation; GD95, day 95 of gestation.

