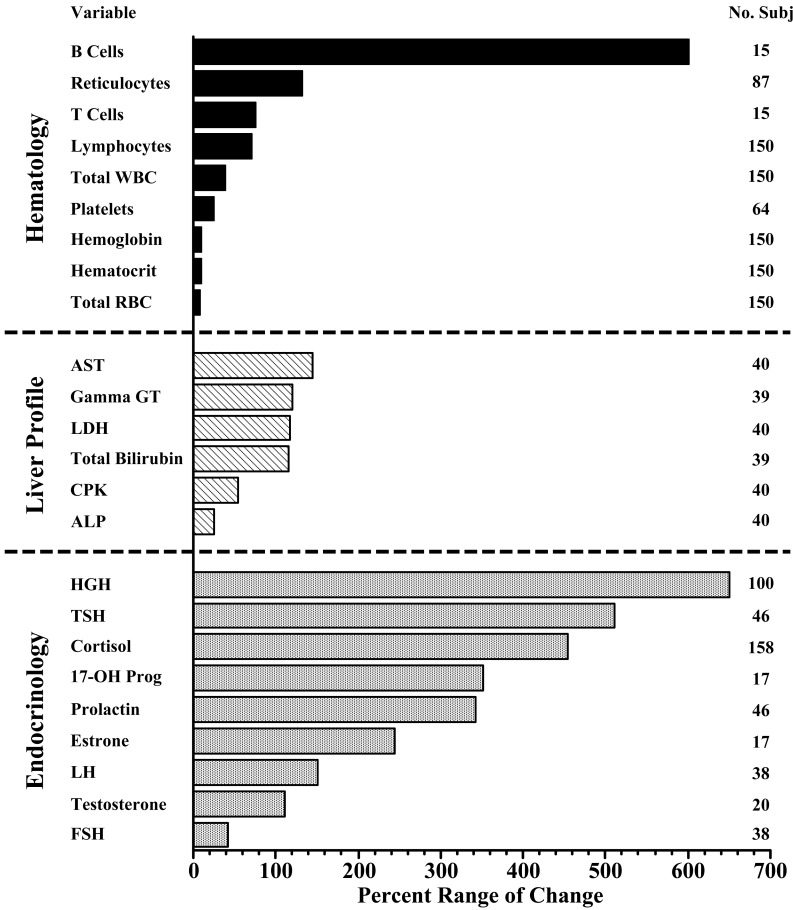
Fig. 2.
Illustrated rationale of the necessity of BTQRVs as BEIs. Figure created using databases of several different studies in which blood samples were collected at 1 to 4 h intervals throughout a single 24 h span from working-age healthy men and women adhering to a routine of diurnal activity and nocturnal sleep and consuming breakfast, lunch, and dinner meals at usual times122,123,124,125,126). Length of the individual horizontal vectors represents the total amount of the 24 h variation displayed in blood samples by selected hematology, liver, and hormone variables. Average magnitude of the day/night variation per variable across subjects is calculated as the difference between the highest and lowest value divided by the 24 h mean of all values multiplied by 100 and expressed in %. Temporal variation in hematological variables is depicted in the top panel; for hemoglobulin, hematocrit, and total RBC (total red blood cells) it is ≤10% and negligible, while for total WBC (total white blood cells) and platelet blood cells it is moderate, and for total lymphocytes, T and B cell lymphocytes, and reticulocytes it is high, ≥100%. Middle panel displays mainly liver function variables; AST (aspartate aminotransferase, also known as serum glutamate oxaloacetate transaminase [SGOT]), Gamma GT (gamma glutamyl transferase), LDH (lactate dehydogenase), CPK (creatine phosphokinase isoenzymes–more indicative of heart, muscle, and brain than liver tissue status), total bilirubin, and ALP (alkaline phosphatase) exhibit extensive, ≥100%, 24 h variation. Bottom endocrinology panel depicts the range of 24 h disparity in the serum concentration of reproductive and other hormones. Most display great, ≥100%, day/night variation; this is particularly evident for HGH (human growth hormone), TST (thyroid stimulating hormone), cortisol, 17-OH Prog (17-OH progesterone), prolactin, estrone (an estrogen), and testosterone, although not for LH (luteinizing hormone).

