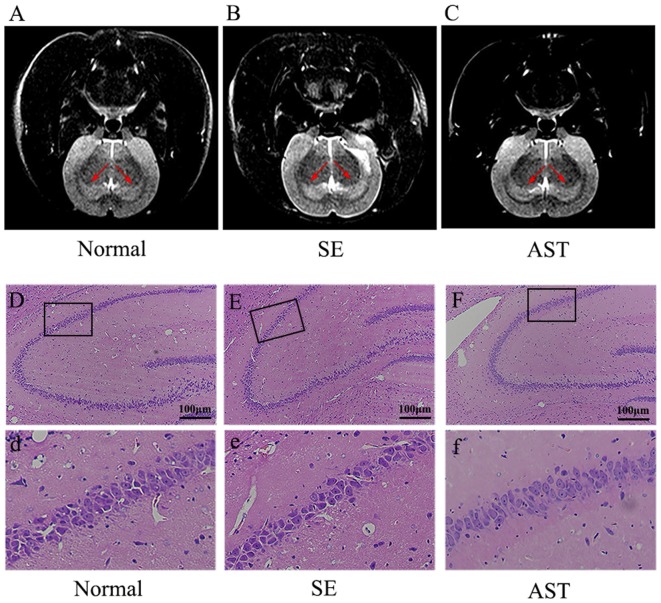
Figure 4.
Observation of the hippocampal damage via MRI and HE staining. Panels (A,B) show the results of T2-weighted phase (T2WI) of MRI. (A) Normal group. (B) SE group. (C) AST group. The T2WIs of the hippocampus of the SE group exhibited a higher signal compared to the Normal group. AST treatment showed a lower signal compared to the SE group. Panels (D–F) show the results of HE staining in the hippocampus. (D,d) Normal group. (E,e) SE group. (F,f) AST group. AST treatment improved the morphological changes in SE rats.

