
Figure 5.
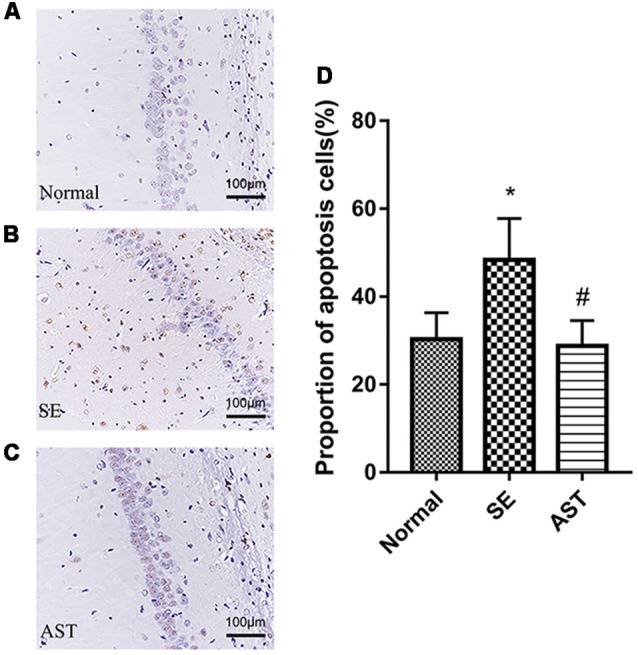
The apoptosis levels in the hippocampal CA1 region via TUNEL staining. (A) Normal group. (B) SE group. (C) AST group. (D) The bar chart shows a proportion of apoptosis cells in the CA1 region in the hippocampus. The results are expressed as the mean ± SD (*p < 0.05 vs. Normal; #p < 0.05 vs. SE).