Figure 3.
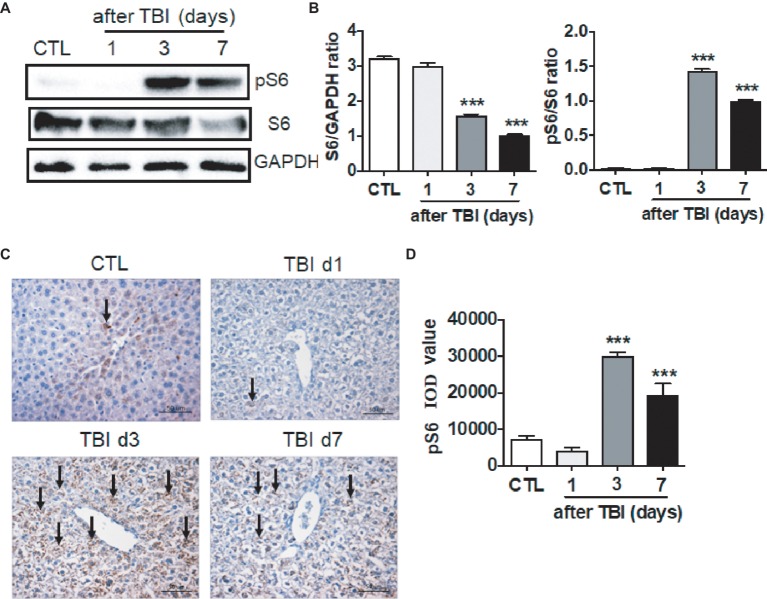
mTORC1 signaling was activated by irradiation in liver tissues. (A and B) Expression of pS6 was upregulated post-irradiation in liver tissues. Expression of pS6 and S6 (A) was detected by western blotting at days 1, 3, and 7 after irradiation (n = 3). GAPDH was used as a housekeeping control. Expression of pS6 and S6 (B) was quantitated by ImageJ software. (C and D) pS6 immunostaining in liver tissues (n = 6). Liver tissues were fixed in 4% paraformaldehyde after irradiation and pS6 immunostaining was performed as indicated in materials and methods (C). Scale bar = 50 μm. Arrows indicate pS6 positive cells. Imaging software was used to analyze the integrated optical density (IOD) of pS6 (D). ***p < 0.001 vs. CTL.

