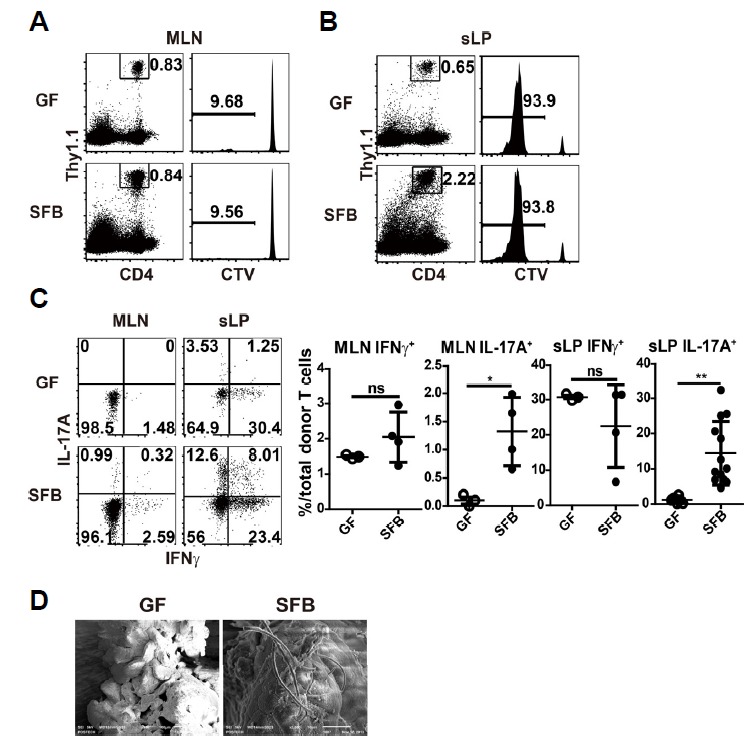
Fig. 1. SFB monocolonization induces effector T cells from a fraction of naïve CD4 T cells.

(A to C) Germ free (GF) B6 hosts were adoptively transferred with 1 × 10⁷ CellTrace Violet (CTV)-labeled CD44lo CD62Lhi Foxp3-GFPneg CD4 T cells from Thy1.1 Foxp3-GFP mice. One day later, mice were SFB-monocolonized and analyzed 13 d later. Representative dot plots show frequencies of donor T cells; histograms show dilution of CTV in mesenteric lymph nodes (MLN) (A) and small intestinal lamina propria (sLP) (B). (C) Dot plots show IFNγ and IL-17A producing donor CD4 T cells after 4 h ex vivo re-stimulation with PMA/ionomycin in the presence of protein transport inhibitor (left). Graphs show the frequencies of indicated cytokine secreting cells (right). (D) Scanning electron microscopy (SEM) images showing SFB colonization in small intestinal ileum. Numbers indicate frequency of cells in adjacent gates or in each quadrant. Each dot represents an individual mouse and horizontal bars indicate mean values. P values were determined by Student’s t-test. Error bars show the mean ± SD. *P < 0.05; **P < 0.01. SFB, segmented filamentous bacteria.
